


Deepali Kank
@deepalikank.in
Freelance Data Visualization Specialist and Data Analyst. 📊 Book nerd📚. Always seeking new insights and knowledge💡Available for Projects.
https://deepalikank.in/
https://deepalikank.in/
Pinned
Deepali Kank
@deepalikank.in
· Mar 11


Reposted by Deepali Kank

To my knowledge, cbfc.watch is the first project of its kind to make updates to film censorship in a country available for subscription with an RSS feed :P
We're tracking and archiving data on India's film censor board and making it as accessible as possible.
We're tracking and archiving data on India's film censor board and making it as accessible as possible.


December 5, 2025 at 4:24 PM
To my knowledge, cbfc.watch is the first project of its kind to make updates to film censorship in a country available for subscription with an RSS feed :P
We're tracking and archiving data on India's film censor board and making it as accessible as possible.
We're tracking and archiving data on India's film censor board and making it as accessible as possible.
Quick plot for #TidyTuesday week 48 - Exploding snowman
Code: github.com/deepdk/TidyT...
#Rstats #DataViz
Code: github.com/deepdk/TidyT...
#Rstats #DataViz

December 2, 2025 at 6:58 AM
Quick plot for #TidyTuesday week 48 - Exploding snowman
Code: github.com/deepdk/TidyT...
#Rstats #DataViz
Code: github.com/deepdk/TidyT...
#Rstats #DataViz
Reposted by Deepali Kank

Ever since we started making documents in Quarto and Typst, I've wanted to make EVERYTHING in Quarto and Typst. Curious to learn how make documents like these? Boy, do I have the blog post for you! #rstats
rfortherestofus.com/2025/11/quar...
rfortherestofus.com/2025/11/quar...
December 1, 2025 at 1:36 PM
Ever since we started making documents in Quarto and Typst, I've wanted to make EVERYTHING in Quarto and Typst. Curious to learn how make documents like these? Boy, do I have the blog post for you! #rstats
rfortherestofus.com/2025/11/quar...
rfortherestofus.com/2025/11/quar...
My Culinary Collection Dashboard received the Best Reactable Table prize at the @posit.co Table Contest 2025.
Thank you to the Posit team and community for the recognition and inspiration.
Congrats to all the winners and participants..
More Info: deepalikank.in
#DataViz #rstats
Thank you to the Posit team and community for the recognition and inspiration.
Congrats to all the winners and participants..
More Info: deepalikank.in
#DataViz #rstats

November 12, 2025 at 3:40 AM
My Culinary Collection Dashboard received the Best Reactable Table prize at the @posit.co Table Contest 2025.
Thank you to the Posit team and community for the recognition and inspiration.
Congrats to all the winners and participants..
More Info: deepalikank.in
#DataViz #rstats
Thank you to the Posit team and community for the recognition and inspiration.
Congrats to all the winners and participants..
More Info: deepalikank.in
#DataViz #rstats


October 31, 2025 at 1:02 PM
Reposted by Deepali Kank

Over the past 1 year, we've switched to Typst for creating PDF reports, because it enhances flexibility and client usability. For JHU's IVAC reports, Typst allowed us to design state-specific exemption boxes.
See how we did it + Typst tips by @joseph-barbier.bsky.social.
buff.ly/PV7zVMZ
#rstats
See how we did it + Typst tips by @joseph-barbier.bsky.social.
buff.ly/PV7zVMZ
#rstats
- YouTube
Enjoy the videos and music you love, upload original content, and share it all with friends, family, and the world on YouTube.
youtu.be
October 30, 2025 at 3:04 PM
Over the past 1 year, we've switched to Typst for creating PDF reports, because it enhances flexibility and client usability. For JHU's IVAC reports, Typst allowed us to design state-specific exemption boxes.
See how we did it + Typst tips by @joseph-barbier.bsky.social.
buff.ly/PV7zVMZ
#rstats
See how we did it + Typst tips by @joseph-barbier.bsky.social.
buff.ly/PV7zVMZ
#rstats
Reposted by Deepali Kank

New Data Viz Event 🚨
Let's be real. This is just an excuse for me to geek out about my favorite topic with my data viz sheroes.
Catch me, @allisonhorst.bsky.social, Kelsey Nanan + @shirleywu.studio on Tuesday Nov 11th @ 1pm ET. Registration link below 😊
streamyard.com/watch/dHiSp8...
Let's be real. This is just an excuse for me to geek out about my favorite topic with my data viz sheroes.
Catch me, @allisonhorst.bsky.social, Kelsey Nanan + @shirleywu.studio on Tuesday Nov 11th @ 1pm ET. Registration link below 😊
streamyard.com/watch/dHiSp8...

Art + science: Blending creativity and analysis in data visualization
Great data visualization lives at the intersection of art and science. By bridging rigorous data analysis with creative design, data visualization has the power to make complex ideas easier to interpr...
streamyard.com
October 28, 2025 at 6:12 PM
New Data Viz Event 🚨
Let's be real. This is just an excuse for me to geek out about my favorite topic with my data viz sheroes.
Catch me, @allisonhorst.bsky.social, Kelsey Nanan + @shirleywu.studio on Tuesday Nov 11th @ 1pm ET. Registration link below 😊
streamyard.com/watch/dHiSp8...
Let's be real. This is just an excuse for me to geek out about my favorite topic with my data viz sheroes.
Catch me, @allisonhorst.bsky.social, Kelsey Nanan + @shirleywu.studio on Tuesday Nov 11th @ 1pm ET. Registration link below 😊
streamyard.com/watch/dHiSp8...
Catching up with hashtag#TidyTuesday.
week 39 - Crane Observations at Lake Hornborgasjön, Sweden (1994–2024)
week 43 - Selected British Literary Prizes (1990-2022)
Both charts created in Observable
Notebooks: observablehq.com/user/@deepal...
#DataViz #JavaScript #Figma
week 39 - Crane Observations at Lake Hornborgasjön, Sweden (1994–2024)
week 43 - Selected British Literary Prizes (1990-2022)
Both charts created in Observable
Notebooks: observablehq.com/user/@deepal...
#DataViz #JavaScript #Figma


October 25, 2025 at 6:05 AM
Catching up with hashtag#TidyTuesday.
week 39 - Crane Observations at Lake Hornborgasjön, Sweden (1994–2024)
week 43 - Selected British Literary Prizes (1990-2022)
Both charts created in Observable
Notebooks: observablehq.com/user/@deepal...
#DataViz #JavaScript #Figma
week 39 - Crane Observations at Lake Hornborgasjön, Sweden (1994–2024)
week 43 - Selected British Literary Prizes (1990-2022)
Both charts created in Observable
Notebooks: observablehq.com/user/@deepal...
#DataViz #JavaScript #Figma
#TidyTuesday week 42 - Historic UK Meteorological & Climate Data
Created an interactive radial rainfall explorer for 37 UK Meteorological Stations with #D3js
Observable Notebook: observablehq.com/d/288e88c4ca...
#DataViz
Created an interactive radial rainfall explorer for 37 UK Meteorological Stations with #D3js
Observable Notebook: observablehq.com/d/288e88c4ca...
#DataViz


October 22, 2025 at 4:04 AM
#TidyTuesday week 42 - Historic UK Meteorological & Climate Data
Created an interactive radial rainfall explorer for 37 UK Meteorological Stations with #D3js
Observable Notebook: observablehq.com/d/288e88c4ca...
#DataViz
Created an interactive radial rainfall explorer for 37 UK Meteorological Stations with #D3js
Observable Notebook: observablehq.com/d/288e88c4ca...
#DataViz

October 20, 2025 at 3:34 AM

October 7, 2025 at 6:07 AM
I created these Truchet tiles in plotnine. Triangle mosaics with geom_polygon() and looping arc chains with geom_path().
Entry for the 2025 plotnine contest.
#DataViz #GenerativeArt #2025plotninecontest
Entry for the 2025 plotnine contest.
#DataViz #GenerativeArt #2025plotninecontest


September 29, 2025 at 5:52 AM
I created these Truchet tiles in plotnine. Triangle mosaics with geom_polygon() and looping arc chains with geom_path().
Entry for the 2025 plotnine contest.
#DataViz #GenerativeArt #2025plotninecontest
Entry for the 2025 plotnine contest.
#DataViz #GenerativeArt #2025plotninecontest
Taste meets tables 🍜📊
For this week’s #TidyTuesday I built a table with {shiny} + {reactable}. In the table, recipes with search, country filters, star ratings, and inline “view details” panels showing images, timings, and ingredients.
There are still a few tweaks to make.
#DataViz #Rstats
For this week’s #TidyTuesday I built a table with {shiny} + {reactable}. In the table, recipes with search, country filters, star ratings, and inline “view details” panels showing images, timings, and ingredients.
There are still a few tweaks to make.
#DataViz #Rstats

September 16, 2025 at 6:01 AM
Taste meets tables 🍜📊
For this week’s #TidyTuesday I built a table with {shiny} + {reactable}. In the table, recipes with search, country filters, star ratings, and inline “view details” panels showing images, timings, and ingredients.
There are still a few tweaks to make.
#DataViz #Rstats
For this week’s #TidyTuesday I built a table with {shiny} + {reactable}. In the table, recipes with search, country filters, star ratings, and inline “view details” panels showing images, timings, and ingredients.
There are still a few tweaks to make.
#DataViz #Rstats
Reposted by Deepali Kank

Launch day 🚀
We’ve just released @chartlecc.bsky.social - a daily chart game!
Your job is to guess which country is represented by the red line in today's chart. You get 5 tries, no other clues!
Play today, come back tomorrow for a different chart with new data and share with your chart friends 📈
We’ve just released @chartlecc.bsky.social - a daily chart game!
Your job is to guess which country is represented by the red line in today's chart. You get 5 tries, no other clues!
Play today, come back tomorrow for a different chart with new data and share with your chart friends 📈

Chartle - A daily chart game
Guess the country in red by analysing today's chart
chartle.cc
September 12, 2025 at 1:41 PM
Launch day 🚀
We’ve just released @chartlecc.bsky.social - a daily chart game!
Your job is to guess which country is represented by the red line in today's chart. You get 5 tries, no other clues!
Play today, come back tomorrow for a different chart with new data and share with your chart friends 📈
We’ve just released @chartlecc.bsky.social - a daily chart game!
Your job is to guess which country is represented by the red line in today's chart. You get 5 tries, no other clues!
Play today, come back tomorrow for a different chart with new data and share with your chart friends 📈
#TidyTuesday week 36 - Henley Passport Index Data.
This one created in #Tableau
each column is a visa-free count;
height = how many countries sit there.
Tableau Public: public.tableau.com/app/profile/...
#DataViz
This one created in #Tableau
each column is a visa-free count;
height = how many countries sit there.
Tableau Public: public.tableau.com/app/profile/...
#DataViz

September 11, 2025 at 12:27 PM
#TidyTuesday week 36 - Henley Passport Index Data.
This one created in #Tableau
each column is a visa-free count;
height = how many countries sit there.
Tableau Public: public.tableau.com/app/profile/...
#DataViz
This one created in #Tableau
each column is a visa-free count;
height = how many countries sit there.
Tableau Public: public.tableau.com/app/profile/...
#DataViz
Catching up with #TidyTuesday week 34 - Billboard hot 100 number ones
I created a visualization exploring the instruments used in every song that topped the Billboard Hot 100 between August 4, 1958 and January 11, 2025 using #Rstats and edited it in #Figma.
#DataViz
I created a visualization exploring the instruments used in every song that topped the Billboard Hot 100 between August 4, 1958 and January 11, 2025 using #Rstats and edited it in #Figma.
#DataViz

September 8, 2025 at 1:13 PM
Catching up with #TidyTuesday week 34 - Billboard hot 100 number ones
I created a visualization exploring the instruments used in every song that topped the Billboard Hot 100 between August 4, 1958 and January 11, 2025 using #Rstats and edited it in #Figma.
#DataViz
I created a visualization exploring the instruments used in every song that topped the Billboard Hot 100 between August 4, 1958 and January 11, 2025 using #Rstats and edited it in #Figma.
#DataViz

September 2, 2025 at 1:23 PM
Quick plot for this week’s #TidyTuesday - Scottish Munros
Code: github.com/deepdk/TidyT...
#Rstats #DataViz
Code: github.com/deepdk/TidyT...
#Rstats #DataViz

August 21, 2025 at 6:18 AM
Quick plot for this week’s #TidyTuesday - Scottish Munros
Code: github.com/deepdk/TidyT...
#Rstats #DataViz
Code: github.com/deepdk/TidyT...
#Rstats #DataViz
Reposted by Deepali Kank

Hello #dataBS (& especially #TidyTuesday) fam! I'm trying to organize a thing to help me keep TidyTuesday running smoothly, but first I need to get a bit of a runway. Every week I curate a TT dataset, and it's wearing me down. Please see github.com/rfordatascie... for some ways you can help! #RStats
August 15, 2025 at 11:23 AM
Hello #dataBS (& especially #TidyTuesday) fam! I'm trying to organize a thing to help me keep TidyTuesday running smoothly, but first I need to get a bit of a runway. Every week I curate a TT dataset, and it's wearing me down. Please see github.com/rfordatascie... for some ways you can help! #RStats
Reposted by Deepali Kank

Notebooks 2.0 is here! 📓🔮 Previewing today:
Notebook Kit, an open file format for notebooks with open-source tooling for generating static sites; and
Observable Desktop, a macOS desktop application for editing notebooks as local files, with a radical new approach to AI. observablehq.com/notebooks/2/
Observable Notebooks 2.0 Technology Preview | Observable
observablehq.com
July 29, 2025 at 2:38 PM
Notebooks 2.0 is here! 📓🔮 Previewing today:
Notebook Kit, an open file format for notebooks with open-source tooling for generating static sites; and
Observable Desktop, a macOS desktop application for editing notebooks as local files, with a radical new approach to AI. observablehq.com/notebooks/2/
Reposted by Deepali Kank

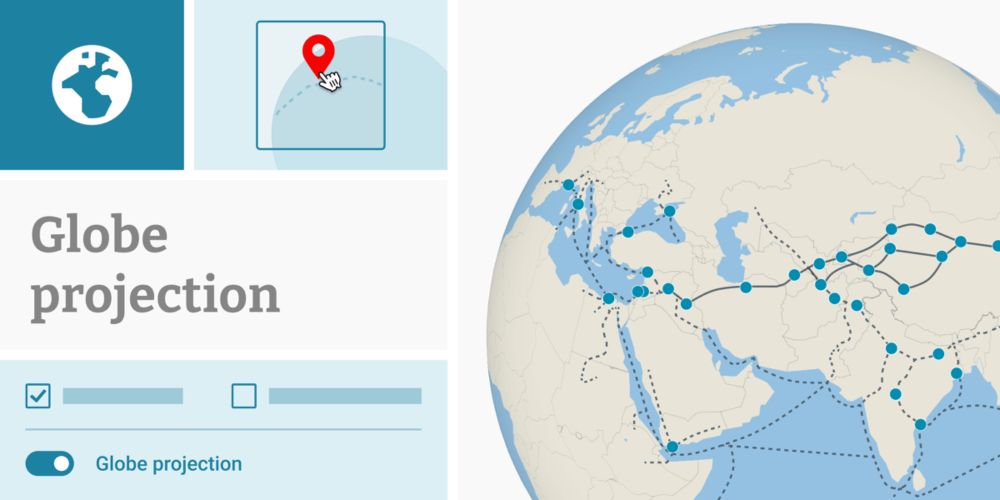
*Huge* new feature in Datawrapper! You can now create locator maps using the globe (aka orthographic) projection. Makes small scale maps so much better compared to the Mercator projection! All thanks to the amazing folks at @datawrapper.de and @maplibre.org ❤️
www.datawrapper.de/blog/new-glo...
www.datawrapper.de/blog/new-glo...
New: Globe projection in locator maps | Datawrapper Blog
Create locator maps using a globe projection
www.datawrapper.de
July 24, 2025 at 4:19 PM
*Huge* new feature in Datawrapper! You can now create locator maps using the globe (aka orthographic) projection. Makes small scale maps so much better compared to the Mercator projection! All thanks to the amazing folks at @datawrapper.de and @maplibre.org ❤️
www.datawrapper.de/blog/new-glo...
www.datawrapper.de/blog/new-glo...
Reposted by Deepali Kank
🎉 Big news! After 5+ years of consulting work under the R for the Rest of Us name, I'm launching Clarity Data Studio.
The name confusion was real – people thought we only did courses, not knowing about our consulting work building reports, websites, and more.
The name confusion was real – people thought we only did courses, not knowing about our consulting work building reports, websites, and more.
July 22, 2025 at 12:54 PM
🎉 Big news! After 5+ years of consulting work under the R for the Rest of Us name, I'm launching Clarity Data Studio.
The name confusion was real – people thought we only did courses, not knowing about our consulting work building reports, websites, and more.
The name confusion was real – people thought we only did courses, not knowing about our consulting work building reports, websites, and more.
#TidyTuesday week 28 - British Library Funding. Created these bookmarks.
Code: github.com/deepdk/TidyT...
#Rstats #DataViz
Code: github.com/deepdk/TidyT...
#Rstats #DataViz

July 17, 2025 at 6:15 AM
#TidyTuesday week 28 - British Library Funding. Created these bookmarks.
Code: github.com/deepdk/TidyT...
#Rstats #DataViz
Code: github.com/deepdk/TidyT...
#Rstats #DataViz
#TidyTuesday week 27 - The xkcd Color Survey Results.
I used the data to create an artistic explosion of colors using #p5js.
Thanks to @nrennie.bsky.social for curating it. This dataset was the perfect playground for a little creative exploration.
#dataviz
I used the data to create an artistic explosion of colors using #p5js.
Thanks to @nrennie.bsky.social for curating it. This dataset was the perfect playground for a little creative exploration.
#dataviz

July 8, 2025 at 6:28 AM
#TidyTuesday week 27 - The xkcd Color Survey Results.
I used the data to create an artistic explosion of colors using #p5js.
Thanks to @nrennie.bsky.social for curating it. This dataset was the perfect playground for a little creative exploration.
#dataviz
I used the data to create an artistic explosion of colors using #p5js.
Thanks to @nrennie.bsky.social for curating it. This dataset was the perfect playground for a little creative exploration.
#dataviz
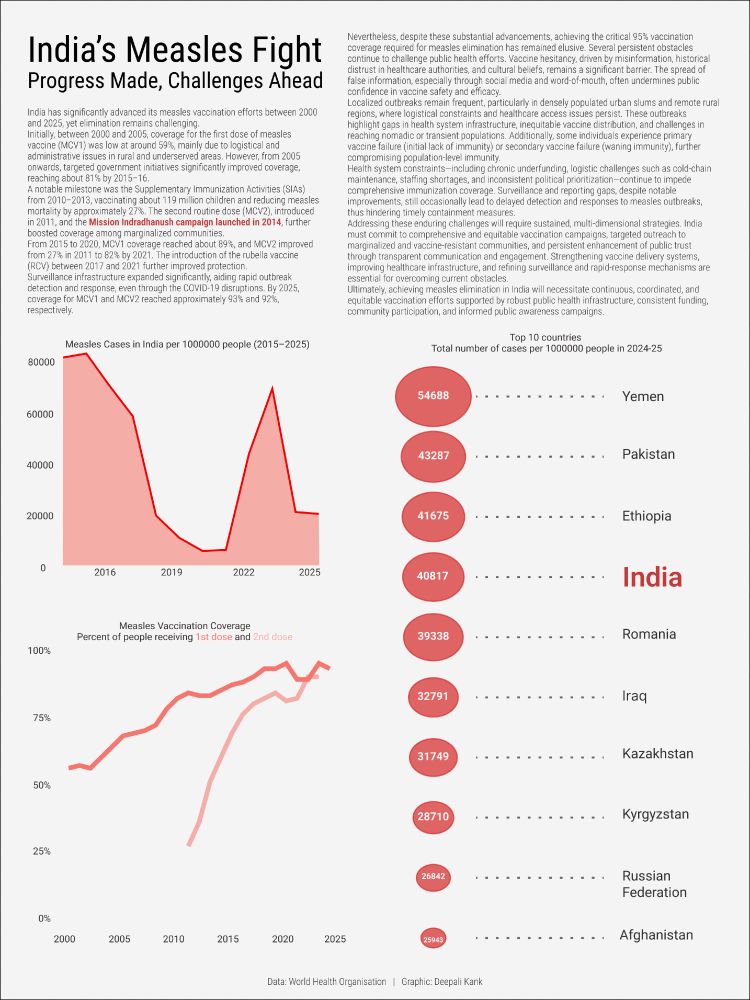
For this week's #TidyTuesday dataset, I explored India's journey toward measles elimination.
The visual layout draws inspiration from newspaper format.
Charts were created in R using #ggplot2
Layout designed in Figma.
#DataVisualization #RStats
The visual layout draws inspiration from newspaper format.
Charts were created in R using #ggplot2
Layout designed in Figma.
#DataVisualization #RStats
June 26, 2025 at 4:59 AM
For this week's #TidyTuesday dataset, I explored India's journey toward measles elimination.
The visual layout draws inspiration from newspaper format.
Charts were created in R using #ggplot2
Layout designed in Figma.
#DataVisualization #RStats
The visual layout draws inspiration from newspaper format.
Charts were created in R using #ggplot2
Layout designed in Figma.
#DataVisualization #RStats