Deepali Kank
@deepalikank.in
2.6K followers 1.8K following 94 posts
Freelance Data Visualization Specialist and Data Analyst. 📊 Book nerd📚. Always seeking new insights and knowledge💡Available for Projects. https://deepalikank.in/
Posts Media Videos Starter Packs
Pinned
deepalikank.in
Happy to share that both of my submissions for the 2024 Information is Beautiful Awards made it to the longlist! 📊✨
🟣 Fragrance of data
🟣 Data Art

#Dataviz #Rstats #DataArt
deepalikank.in
#TidyTuesday week 40 - EuroLeague Basketball
#DataViz
deepalikank.in
I created these Truchet tiles in plotnine. Triangle mosaics with geom_polygon() and looping arc chains with geom_path().
Entry for the 2025 plotnine contest.
#DataViz #GenerativeArt #2025plotninecontest
deepalikank.in
Taste meets tables 🍜📊
For this week’s #TidyTuesday I built a table with {shiny} + {reactable}. In the table, recipes with search, country filters, star ratings, and inline “view details” panels showing images, timings, and ingredients.
There are still a few tweaks to make.
#DataViz #Rstats
Reposted by Deepali Kank
erwanrivault.com
Launch day 🚀

We’ve just released @chartlecc.bsky.social - a daily chart game!

Your job is to guess which country is represented by the red line in today's chart. You get 5 tries, no other clues!

Play today, come back tomorrow for a different chart with new data and share with your chart friends 📈
Chartle - A daily chart game
Guess the country in red by analysing today's chart
chartle.cc
deepalikank.in
#TidyTuesday week 36 - Henley Passport Index Data.
This one created in #Tableau
each column is a visa-free count;
height = how many countries sit there.
Tableau Public: public.tableau.com/app/profile/...
#DataViz
A stacked bar chart titled “How many doors does each passport open in 2025.” The x-axis shows the number of visa-free destinations, ranging from 20 to 190, while the y-axis shows how many countries fall into each category. Each small block represents a country, color-coded by region: Africa, Americas, Asia, Caribbean, Europe, Middle East, and Oceania.
deepalikank.in
Catching up with #TidyTuesday week 34 - Billboard hot 100 number ones
I created a visualization exploring the instruments used in every song that topped the Billboard Hot 100 between August 4, 1958 and January 11, 2025 using #Rstats and edited it in #Figma.
#DataViz
deepalikank.in
#TidyTuesday week 35 - Australian Frogs
Code: github.com/deepdk/TidyT...
#DataViz #Rstats
deepalikank.in
Quick plot for this week’s #TidyTuesday - Scottish Munros
Code: github.com/deepdk/TidyT...
#Rstats #DataViz
A grid of triangle-shaped plots showing the number of Scottish Munros and Munro Tops across survey years from 1891 to 2021. Each year is represented by two adjacent colored triangles: green for Munros and purple for Munro Tops. Numbers inside the triangles indicate counts, e.g., in 1891 there were 283 Munros and 255 Munro Tops, while in 2021 there were 282 Munros and 226 Munro Tops. The chart highlights fluctuations in classifications over time. Title reads “Scottish Munros” with a note that Munros are Scottish mountains over 3,000 ft, and Munro Tops are subsidiary summits over 3,000 ft.
Reposted by Deepali Kank
jonthegeek.com
Hello #dataBS (& especially #TidyTuesday) fam! I'm trying to organize a thing to help me keep TidyTuesday running smoothly, but first I need to get a bit of a runway. Every week I curate a TT dataset, and it's wearing me down. Please see github.com/rfordatascie... for some ways you can help! #RStats
Reposted by Deepali Kank
ocks.org
Notebooks 2.0 is here! 📓🔮 Previewing today:
Notebook Kit, an open file format for notebooks with open-source tooling for generating static sites; and
Observable Desktop, a macOS desktop application for editing notebooks as local files, with a radical new approach to AI. observablehq.com/notebooks/2/
Observable Notebooks 2.0 Technology Preview | Observable
observablehq.com
Reposted by Deepali Kank
driven-by-data.net
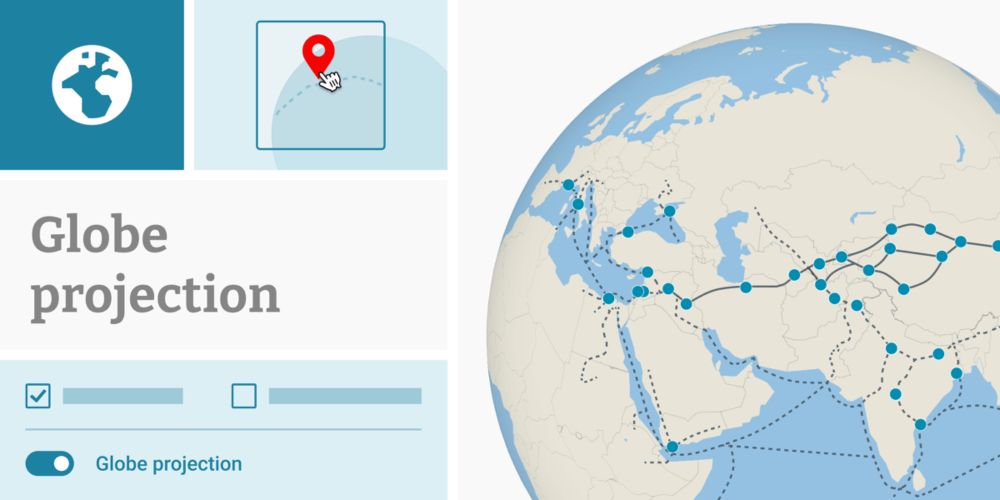
*Huge* new feature in Datawrapper! You can now create locator maps using the globe (aka orthographic) projection. Makes small scale maps so much better compared to the Mercator projection! All thanks to the amazing folks at @datawrapper.de and @maplibre.org ❤️
www.datawrapper.de/blog/new-glo...
New: Globe projection in locator maps | Datawrapper Blog
Create locator maps using a globe projection
www.datawrapper.de
Reposted by Deepali Kank
dgkeyes.com
🎉 Big news! After 5+ years of consulting work under the R for the Rest of Us name, I'm launching Clarity Data Studio.

The name confusion was real – people thought we only did courses, not knowing about our consulting work building reports, websites, and more.
deepalikank.in
Thanks for the mention, Dave.!
deepalikank.in
#TidyTuesday week 28 - British Library Funding. Created these bookmarks.
Code: github.com/deepdk/TidyT...
#Rstats #DataViz
deepalikank.in
#TidyTuesday week 27 - The xkcd Color Survey Results.
I used the data to create an artistic explosion of colors using #p5js.
Thanks to @nrennie.bsky.social for curating it. This dataset was the perfect playground for a little creative exploration.
#dataviz
deepalikank.in
This is so creative. Love it.
deepalikank.in
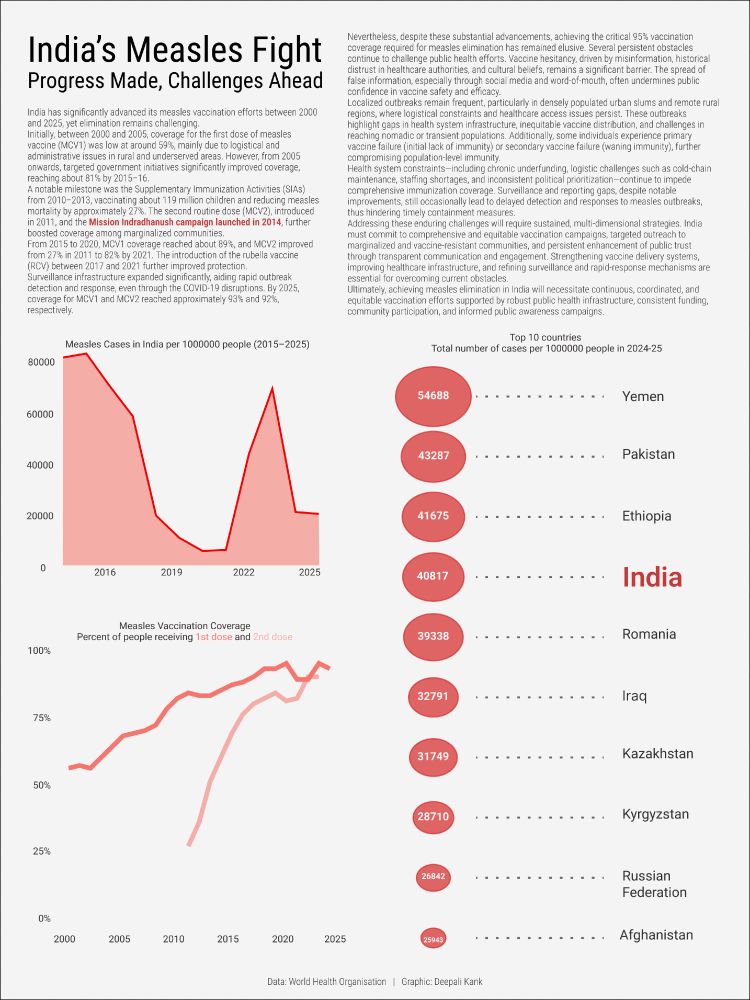
For this week's #TidyTuesday dataset, I explored India's journey toward measles elimination.
The visual layout draws inspiration from newspaper format.
Charts were created in R using #ggplot2
Layout designed in Figma.

#DataVisualization #RStats
Reposted by Deepali Kank
datawrapper.de
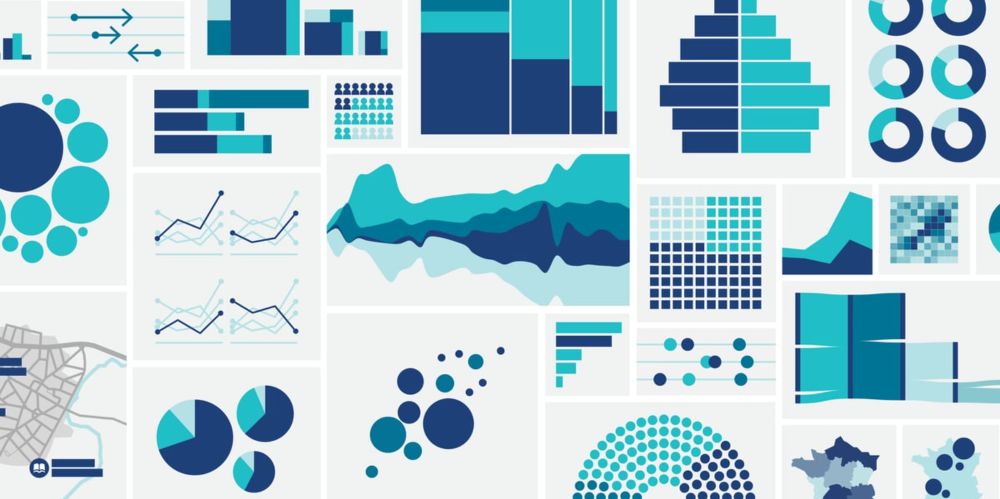
📊 New blog post! Arrow plots, alluvial diagrams, choropleth maps — when you’re just starting out, the number (and names!) of viz types can be overwhelming.

Our writer @lisacmuth.bsky.social put together a guide and poster to help you choose the right one: www.datawrapper.de/blog/chart-t...
A friendly guide to choosing a chart type | Datawrapper Blog
A fun overview of 40 visualization types and when to use them.
www.datawrapper.de
Reposted by Deepali Kank
revisual.co
Today marks 2 years of Revisual Labs, and we celebrated this milestone at the Outlier Conference in Miami, where we won the silver for "Outstanding Studio" at the international Information Is Beautiful Awards 🏆
deepalikank.in
Thanks Libby.!
deepalikank.in
#TidyTuesday week 23 - U.S Judges.
#Rstats #DataViz
deepalikank.in
p5.js and processing both are tools for creative coding. with the same principles but with slightly different syntax.