


Dan McNeish
@dmcneish.bsky.social
Quant Psyc professor at Arizona State. Into clustered data, latent variables, psychometrics, intensive longitudinal data, and growth modeling.
https://sites.google.com/site/danielmmcneish
https://sites.google.com/site/danielmmcneish
Reposted by Dan McNeish

We built the openESM database:
▶️60 openly available experience sampling datasets (16K+ participants, 740K+ obs.) in one place
▶️Harmonized (meta-)data, fully open-source software
▶️Filter & search all data, simply download via R/Python
Find out more:
🌐 openesmdata.org
📝 doi.org/10.31234/osf...
▶️60 openly available experience sampling datasets (16K+ participants, 740K+ obs.) in one place
▶️Harmonized (meta-)data, fully open-source software
▶️Filter & search all data, simply download via R/Python
Find out more:
🌐 openesmdata.org
📝 doi.org/10.31234/osf...
October 22, 2025 at 7:34 PM
We built the openESM database:
▶️60 openly available experience sampling datasets (16K+ participants, 740K+ obs.) in one place
▶️Harmonized (meta-)data, fully open-source software
▶️Filter & search all data, simply download via R/Python
Find out more:
🌐 openesmdata.org
📝 doi.org/10.31234/osf...
▶️60 openly available experience sampling datasets (16K+ participants, 740K+ obs.) in one place
▶️Harmonized (meta-)data, fully open-source software
▶️Filter & search all data, simply download via R/Python
Find out more:
🌐 openesmdata.org
📝 doi.org/10.31234/osf...
Reposted by Dan McNeish

In a new paper, my colleagues and I set out to demonstrate how method biases can create spurious findings in relationship science, by using a seemingly meaningless scale (e.g., "My relationship has very good Saturn") to predict relationship outcomes. journals.sagepub.com/doi/10.1177/...

Pseudo Effects: How Method Biases Can Produce Spurious Findings About Close Relationships - Samantha Joel, John K. Sakaluk, James J. Kim, Devinder Khera, Helena Yuchen Qin, Sarah C. E. Stanton, 2025
Research on interpersonal relationships frequently relies on accurate self-reporting across various relationship facets (e.g., conflict, trust, appreciation). Y...
journals.sagepub.com
September 10, 2025 at 6:18 PM
In a new paper, my colleagues and I set out to demonstrate how method biases can create spurious findings in relationship science, by using a seemingly meaningless scale (e.g., "My relationship has very good Saturn") to predict relationship outcomes. journals.sagepub.com/doi/10.1177/...
Tenure-Track Quant Psyc job opening at Northern Arizona University in Flagstaff. Areas of interest are pretty broad (SEM, multilevel, or psychometrics), the deadline to apply is coming up soon (Sept 15) if you're interested!
careers.nau.edu/jobs/assista...
careers.nau.edu/jobs/assista...

Assistant Professor, Psychological Sciences - Flagstaff, Arizona, United States
About the Department/College
The Department of Psychological Sciences is located on the Flagstaff Mountain Campus of Northern Arizona University (NAU), situated at the base of San Francisco Peaks. NAU...
careers.nau.edu
September 3, 2025 at 9:21 PM
Tenure-Track Quant Psyc job opening at Northern Arizona University in Flagstaff. Areas of interest are pretty broad (SEM, multilevel, or psychometrics), the deadline to apply is coming up soon (Sept 15) if you're interested!
careers.nau.edu/jobs/assista...
careers.nau.edu/jobs/assista...
Reposted by Dan McNeish

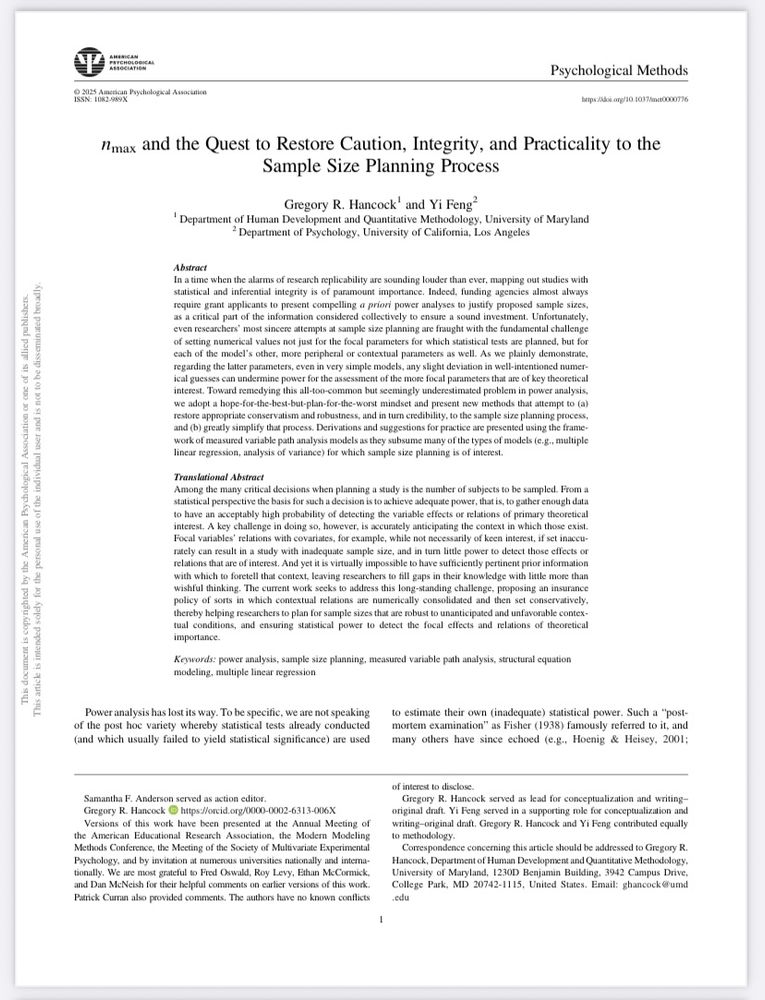
For those interested, here is a link to a new power paper:
Hancock, G. R., & Feng, Y. (2026). nmax and the quest to
restore caution, integrity, and practicality to the sample size planning process. Psychological Methods.
yifengquant.github.io/Publications...
Hancock, G. R., & Feng, Y. (2026). nmax and the quest to
restore caution, integrity, and practicality to the sample size planning process. Psychological Methods.
yifengquant.github.io/Publications...
August 19, 2025 at 1:04 AM
For those interested, here is a link to a new power paper:
Hancock, G. R., & Feng, Y. (2026). nmax and the quest to
restore caution, integrity, and practicality to the sample size planning process. Psychological Methods.
yifengquant.github.io/Publications...
Hancock, G. R., & Feng, Y. (2026). nmax and the quest to
restore caution, integrity, and practicality to the sample size planning process. Psychological Methods.
yifengquant.github.io/Publications...
Reposted by Dan McNeish

🧵
Very excited (w/ @omarjcamanto.bsky.social) to share our preprint tutorial for using our R 📦 dySEM for #dyadic data analysis with latent variables, in cross-sectional data sets.
This paper has been literal years in the making, and provides three distinct tutorials.
osf.io/preprints/ps...
Very excited (w/ @omarjcamanto.bsky.social) to share our preprint tutorial for using our R 📦 dySEM for #dyadic data analysis with latent variables, in cross-sectional data sets.
This paper has been literal years in the making, and provides three distinct tutorials.
osf.io/preprints/ps...
July 10, 2025 at 2:44 PM
🧵
Very excited (w/ @omarjcamanto.bsky.social) to share our preprint tutorial for using our R 📦 dySEM for #dyadic data analysis with latent variables, in cross-sectional data sets.
This paper has been literal years in the making, and provides three distinct tutorials.
osf.io/preprints/ps...
Very excited (w/ @omarjcamanto.bsky.social) to share our preprint tutorial for using our R 📦 dySEM for #dyadic data analysis with latent variables, in cross-sectional data sets.
This paper has been literal years in the making, and provides three distinct tutorials.
osf.io/preprints/ps...
Reposted by Dan McNeish

‼️ New paper @ Child Development discussing why it is inappropriate to use traditional common factor models to model adverse childhood experienced (ACEs) and other stressor inventories ‼️
Read full (brief) paper at srcd.onlinelibrary.wiley.com/doi/full/10....
@srcdorg.bsky.social #PsychSciSky
1/9
Read full (brief) paper at srcd.onlinelibrary.wiley.com/doi/full/10....
@srcdorg.bsky.social #PsychSciSky
1/9

<em>Child Development</em> | SRCD Journal | Wiley Online Library
Adverse childhood experiences (ACEs) are highly impactful stressors that increase individuals' risk for a plethora of negative developmental and health outcomes. Furthermore, minoritized groups and u...
srcd.onlinelibrary.wiley.com
April 22, 2025 at 2:24 PM
‼️ New paper @ Child Development discussing why it is inappropriate to use traditional common factor models to model adverse childhood experienced (ACEs) and other stressor inventories ‼️
Read full (brief) paper at srcd.onlinelibrary.wiley.com/doi/full/10....
@srcdorg.bsky.social #PsychSciSky
1/9
Read full (brief) paper at srcd.onlinelibrary.wiley.com/doi/full/10....
@srcdorg.bsky.social #PsychSciSky
1/9
New paper on dealing with MNAR intensive longitudinal data. Ran into this problem in an empirical study and didn't find too much in the methods literature on MNAR ILD, so this was the best I could come up with. Lots of opportunity to improve methods in this area!
psycnet.apa.org/record/2025-...
psycnet.apa.org/record/2025-...

April 2, 2025 at 9:19 AM
New paper on dealing with MNAR intensive longitudinal data. Ran into this problem in an empirical study and didn't find too much in the methods literature on MNAR ILD, so this was the best I could come up with. Lots of opportunity to improve methods in this area!
psycnet.apa.org/record/2025-...
psycnet.apa.org/record/2025-...
New paper - coefficients like alpha/omega are commonly reported to summarize reliability. A sneaky nuance is that reliability is actually different at each score in the data. Paper tries to quantify how representative alpha/omega are of a typical score.
link.springer.com/article/10.3...
link.springer.com/article/10.3...
link.springer.com
February 18, 2025 at 9:15 AM
New paper - coefficients like alpha/omega are commonly reported to summarize reliability. A sneaky nuance is that reliability is actually different at each score in the data. Paper tries to quantify how representative alpha/omega are of a typical score.
link.springer.com/article/10.3...
link.springer.com/article/10.3...
This paper on intensive longitudinal reliability led by Sebastian Castro-Alvarez is one of the best I've read in a while -- the review was so thorough, the code was fantastic, and it answered any questions I had about IL reliability. Definitely check it out you work with ILD!
osf.io/preprints/ps...
osf.io/preprints/ps...
OSF
osf.io
January 29, 2025 at 7:39 PM
This paper on intensive longitudinal reliability led by Sebastian Castro-Alvarez is one of the best I've read in a while -- the review was so thorough, the code was fantastic, and it answered any questions I had about IL reliability. Definitely check it out you work with ILD!
osf.io/preprints/ps...
osf.io/preprints/ps...
Next week, I'm teaching a 3-day workshop on DSEM for intensive longitudinal data using Mplus and registration is still open -- more information about the topics and registration can be found here!
statisticalhorizons.com/seminars/dyn...
statisticalhorizons.com/seminars/dyn...

Dynamic Structural Equation Modeling Seminar | Statistics Course
This online course by Dan McNeish Ph.D., introduces both foundational and intermediate topics in DSEM.
statisticalhorizons.com
January 29, 2025 at 1:41 AM
Next week, I'm teaching a 3-day workshop on DSEM for intensive longitudinal data using Mplus and registration is still open -- more information about the topics and registration can be found here!
statisticalhorizons.com/seminars/dyn...
statisticalhorizons.com/seminars/dyn...
Reposted by Dan McNeish
I don't understand how you can read and understand an evolving literature without keeping up with methodological developments.
What are we supposed to do, just read discussion sections and take people's word for it?
What are we supposed to do, just read discussion sections and take people's word for it?
November 30, 2024 at 4:49 PM
I don't understand how you can read and understand an evolving literature without keeping up with methodological developments.
What are we supposed to do, just read discussion sections and take people's word for it?
What are we supposed to do, just read discussion sections and take people's word for it?
Reposted by Dan McNeish
The basic principle is that reviewers are tired, they're rushed, they're reading your and 10 other grants on top of their normal workload.
Anything you can do to make it easy for them will help.
Here's a list of my suggestions.
Anything you can do to make it easy for them will help.
Here's a list of my suggestions.
As a grant reviewer, what do you really wish people would do/not do?
Not big things, like find a significant question/innovative method/be consistent with aims
Little things, like bold each acronym the first time it’s used.
Add your pet peeves ⬇️
#HiddenCurriculum #Research
Not big things, like find a significant question/innovative method/be consistent with aims
Little things, like bold each acronym the first time it’s used.
Add your pet peeves ⬇️
#HiddenCurriculum #Research
November 23, 2024 at 2:57 PM
The basic principle is that reviewers are tired, they're rushed, they're reading your and 10 other grants on top of their normal workload.
Anything you can do to make it easy for them will help.
Here's a list of my suggestions.
Anything you can do to make it easy for them will help.
Here's a list of my suggestions.
Reposted by Dan McNeish

Who should you nominate as reviewers for your manuscript? After a long chat with a post-grad it appears that there's a lot of misguided advice out there. Thread 👇
November 22, 2024 at 11:05 AM
Who should you nominate as reviewers for your manuscript? After a long chat with a post-grad it appears that there's a lot of misguided advice out there. Thread 👇
This article gives a phenomenal overview of the history and evolution of best practices in measurement invariance and differential item functioning -- I can't remember the last time I learned so much reading a single paper, highly recommended!
www.tandfonline.com/doi/full/10....
www.tandfonline.com/doi/full/10....

A Review of Some of the History of Factorial Invariance and Differential Item Functioning
The concept of factorial invariance has evolved since it originated in the 1930s as a criterion for the usefulness of the multiple factor model; it has become a form of analysis supporting the vali...
www.tandfonline.com
November 13, 2024 at 10:25 PM
This article gives a phenomenal overview of the history and evolution of best practices in measurement invariance and differential item functioning -- I can't remember the last time I learned so much reading a single paper, highly recommended!
www.tandfonline.com/doi/full/10....
www.tandfonline.com/doi/full/10....
Posting for a Bsky-less friend -- New quant job posting for an Asst Professor at the University of Georgia in machine learning/data science/AI (very broadly defined) with applications to educational research. Due date is Dec 2!
www.ugajobsearch.com/postings/403...
www.ugajobsearch.com/postings/403...
Assistant Professor (Quantitative Methodology)
The Quantitative Methodology (QM) Program in Department of Educational Psychology at the University of Georgia invites applications for a tenure-track Assistant Professor with expertise in Educational...
www.ugajobsearch.com
November 5, 2024 at 9:48 AM
Posting for a Bsky-less friend -- New quant job posting for an Asst Professor at the University of Georgia in machine learning/data science/AI (very broadly defined) with applications to educational research. Due date is Dec 2!
www.ugajobsearch.com/postings/403...
www.ugajobsearch.com/postings/403...
New Paper w/@melissagwolf.bsky.social- Dynamic fit cutoffs now support any covariance structure model (e.g., bifactor, hierarchical, & mediation models). Also supports categorical and non-normal outcomes Use the DDDFI function in dynamic package on GitHub
www.tandfonline.com/doi/full/10.... /1
www.tandfonline.com/doi/full/10.... /1

Direct Discrepancy Dynamic Fit Index Cutoffs for Arbitrary Covariance Structure Models
Despite the popularity of traditional fit index cutoffs like RMSEA ≤ .06 and CFI ≥ .95, several studies have noted issues with overgeneralizing traditional cutoffs. Computational methods have been ...
www.tandfonline.com
October 31, 2024 at 9:20 AM
New Paper w/@melissagwolf.bsky.social- Dynamic fit cutoffs now support any covariance structure model (e.g., bifactor, hierarchical, & mediation models). Also supports categorical and non-normal outcomes Use the DDDFI function in dynamic package on GitHub
www.tandfonline.com/doi/full/10.... /1
www.tandfonline.com/doi/full/10.... /1
New paper w/ Roy Levy
These 2 path diagrams are conceptually different (regression with a latent predictor that has 3 indicators vs. a factor model with 4 indicators) but they are mathematically equivalent.
journals.sagepub.com/doi/10.3102/...
/1
These 2 path diagrams are conceptually different (regression with a latent predictor that has 3 indicators vs. a factor model with 4 indicators) but they are mathematically equivalent.
journals.sagepub.com/doi/10.3102/...
/1

September 25, 2024 at 9:29 AM
New paper w/ Roy Levy
These 2 path diagrams are conceptually different (regression with a latent predictor that has 3 indicators vs. a factor model with 4 indicators) but they are mathematically equivalent.
journals.sagepub.com/doi/10.3102/...
/1
These 2 path diagrams are conceptually different (regression with a latent predictor that has 3 indicators vs. a factor model with 4 indicators) but they are mathematically equivalent.
journals.sagepub.com/doi/10.3102/...
/1
Reposted by Dan McNeish

Psychology really needs to go back to square 1 on measurement. Even the major replications haven’t taken the lack of valid measures seriously. We are making up questions and questionnaires daily w/o validating constructs or tasks. This means our foundation is seriously shaky @jkflake.bsky.social
February 23, 2024 at 1:14 PM
Psychology really needs to go back to square 1 on measurement. Even the major replications haven’t taken the lack of valid measures seriously. We are making up questions and questionnaires daily w/o validating constructs or tasks. This means our foundation is seriously shaky @jkflake.bsky.social
Reposted by Dan McNeish
Yesterday I spent the day at an interdisciplinary meeting about rigor in science. It was a little depressing in what we are still working through regarding poor practices and incentives in science. Also, uplifting in that the movement to rectify the issues-has/is creating tools to move forward 1/n
February 23, 2024 at 1:04 PM
Yesterday I spent the day at an interdisciplinary meeting about rigor in science. It was a little depressing in what we are still working through regarding poor practices and incentives in science. Also, uplifting in that the movement to rectify the issues-has/is creating tools to move forward 1/n
Reposted by Dan McNeish

How do we measure experiences of loneliness in daily life? A thread for clinical psychologists, relationship scientists, EMA nerds, and measurement geeks 🧵👇
Preregistration, data, analysis scripts, and materials at osf.io/cwgme/.
#psychscisky #rstats #statssky
Preregistration, data, analysis scripts, and materials at osf.io/cwgme/.
#psychscisky #rstats #statssky

Measuring Loneliness in Everyday Life: http://osf.io/64ns9/
December 29, 2023 at 4:11 AM
How do we measure experiences of loneliness in daily life? A thread for clinical psychologists, relationship scientists, EMA nerds, and measurement geeks 🧵👇
Preregistration, data, analysis scripts, and materials at osf.io/cwgme/.
#psychscisky #rstats #statssky
Preregistration, data, analysis scripts, and materials at osf.io/cwgme/.
#psychscisky #rstats #statssky
Reposted by Dan McNeish
"Dynamic structural equation models with binary and ordinal outcomes in Mplus" - comes with a handy MPlus tutorial!
link.springer.com/article/10.3...
@dmcneish.bsky.social Somers & Savord
link.springer.com/article/10.3...
@dmcneish.bsky.social Somers & Savord

December 4, 2023 at 8:17 PM
"Dynamic structural equation models with binary and ordinal outcomes in Mplus" - comes with a handy MPlus tutorial!
link.springer.com/article/10.3...
@dmcneish.bsky.social Somers & Savord
link.springer.com/article/10.3...
@dmcneish.bsky.social Somers & Savord
Reposted by Dan McNeish
I somehow (!?!) missed that @dmcneish.bsky.social and Wolf have a dynamic fit indices Shiny app? Slapping this right into my measurement seminar slides. dynamicfit.app/connect/
November 30, 2023 at 6:05 PM
I somehow (!?!) missed that @dmcneish.bsky.social and Wolf have a dynamic fit indices Shiny app? Slapping this right into my measurement seminar slides. dynamicfit.app/connect/
Reposted by Dan McNeish

Follow Dan because chances are that if you are wishing for a paper on an under-documented yet essential stats thing, he will have written it within the next 30 days
Most papers comparing clustered data methods use biostat/econ language, so I tried to write one using psyc/ed language that covers the origin of the independence assumption, how each method handles ind. violations, and types of questions best-suited for each method
psycnet.apa.org/record/2024-...
psycnet.apa.org/record/2024-...

November 29, 2023 at 2:07 AM
Follow Dan because chances are that if you are wishing for a paper on an under-documented yet essential stats thing, he will have written it within the next 30 days
Most papers comparing clustered data methods use biostat/econ language, so I tried to write one using psyc/ed language that covers the origin of the independence assumption, how each method handles ind. violations, and types of questions best-suited for each method
psycnet.apa.org/record/2024-...
psycnet.apa.org/record/2024-...
November 28, 2023 at 8:54 AM
Most papers comparing clustered data methods use biostat/econ language, so I tried to write one using psyc/ed language that covers the origin of the independence assumption, how each method handles ind. violations, and types of questions best-suited for each method
psycnet.apa.org/record/2024-...
psycnet.apa.org/record/2024-...