Lisa Hornung
@lisahornung.bsky.social
1.4K followers 460 following 72 posts
Data Visualisation Manager at a health think tank 👩‍💻 Mostly talk about data, #dataviz, #opendata, #maps, #python and #data4good 📈 Into cycling, yoga, sourdough, puns and more. Views my own. Also active on Mastodon + Linkedin
Posts Media Videos Starter Packs
Reposted by Lisa Hornung
karimdouieb.bsky.social
🍩 What if climate looked like a donut? 🌍
Here’s a bunch of cities turned into a sweet dataviz experiment.

🟡 → comfy zone
🔴 → hot
🔵 → cold

Why a donut? Let me explain 👇
lisahornung.bsky.social
What if all munros (mountains in Scotland > 3000ft or 914.4m) were on a single munro? 🗻

Fun visual experiment for #TidyTuesday / #PydyTuesday using python, pandas, matplotlib, pyfonts. Thanks to @nrennie.bsky.social for collating the dataset 🙏

Code github.com/Lisa-Ho/smal...
Scottish munros on a single munro. All 281 active munros in Scotland places on circular elevation lines around the highest one (Ben Nevis). They are depicted by triangle markers and coloured by their estimated (true) distance to Ben Nevis.
lisahornung.bsky.social
I just found out about 'Spreadsheet Champions' - a first of a kind documentary about people competing in an official Microsoft #Excel competition 😯😱 I so want to watch this!!!

Might be difficult to find a place to stream it, any ideas, send them my way 🙏

www.theguardian.com/film/2025/au...
Excelling in … Excel? Inside the high-stakes, secretive world of competitive spreadsheeting
New documentary Spreadsheet Champions follows six competitors as they head to the Microsoft Office Specialist world championship in Florida
www.theguardian.com
lisahornung.bsky.social
When I needed to do something specific in Excel (for similar reasons) I often found very useful tutorials from Jon Schwabish policyviz.com/category/tut... I think he also wrote a whole book about Data viz in Excel
Tutorials Archives - PolicyViz
policyviz.com
lisahornung.bsky.social
We organise monthly hybrid sessions - they take about 1hr, usually around/after lunch time, and are quite informal and open in terms of topic, ie you can present about a new analysis method or how to make your charts look better. Whatever you fancy. It just turned 1 year about a month ago 🎉
lisahornung.bsky.social
I'm using VS Code I'm afraid 😅
lisahornung.bsky.social
Had a lot of fun coming up with a title for my #Quarto demo I presented at our internal learning sessions aka R-Cafes 😆

So here you go ... Quarto Macchiato ☕🥛 #Python #Rstats
Screenshot of the title slide of a presentation called: Quarto Macchiato - layering R, Python + Javascript like a Pro. It also shows an image of a Latte Macchiato with visible layers of milk, coffee and milk foam.
Reposted by Lisa Hornung
pengzell.bsky.social
Data in a csv format
which we converted to a pdf
which we printed
which we then scanned
which we embedded in a slide deck
which we then encrypted
which we lost the password to
and cited as “available upon request”
lisahornung.bsky.social
This made me laugh! #UX in the wild. (Coffee machine at my local IKEA store) 😅
Image of a coffee machine touchscreen that has a bright circle below the touchpad and a arrow pointing at the circle saying "This is not a button"
lisahornung.bsky.social
Tbf, I had worked with color codes and spaces before, so that helped 😅 and I def went over 1 hour (that's usually your limit right?)
lisahornung.bsky.social
People in some areas of England and Wales are almost twice as likely to die before 75 (premature mortality).

Out latest analysis shows rates are highest in the North East, the North West and Yorkshire and the Humber, and lowest in London (> Richmond)

Learn more www.health.org.uk/reports-and-...
Dot plot of premature mortality rates (deaths per 100,00o people) by local authority and region in England and Wales. Each circle is sized by the number of people aged 18-74. North East, Yorkshire and Humber, and North West have some of the highest premature mortality rates.
Reposted by Lisa Hornung
mattzollerseitz.bsky.social
I appreciate the optimism of this parking validation machine
Photo of the screen of a parking validation machine that says "please pay displayed amount: five dollars", and underneath that, "change is possible."
lisahornung.bsky.social
Had some fun plotting colors in 3D for #TidyTuesday #PydyTuesday

The top 100 color names in the 2010 xkcd color name survey by hue, lightness and saturation. Interactive chart made with python + plotly + quarto inside-numbers.quarto.pub/top-100-colo...

Code: github.com/Lisa-Ho/smal...
3D scatter plot mapping the top 100 color names in the xkcd color name survey by hue, saturation and lightness. each circle is also coloured in the equivalent hex code and sized by the rank.
lisahornung.bsky.social
Tricky one. #TidyTuesday usually gets you a lot more traction. Sometimes I do #python + #dataviz or tag matplotlib as Hannah said. The python world is quite broad, so not everyone will be interested in seeing plots 😅 maybe it's time for a dedicated list? I would follow it ☺️
Reposted by Lisa Hornung
datavisfriendly.bsky.social
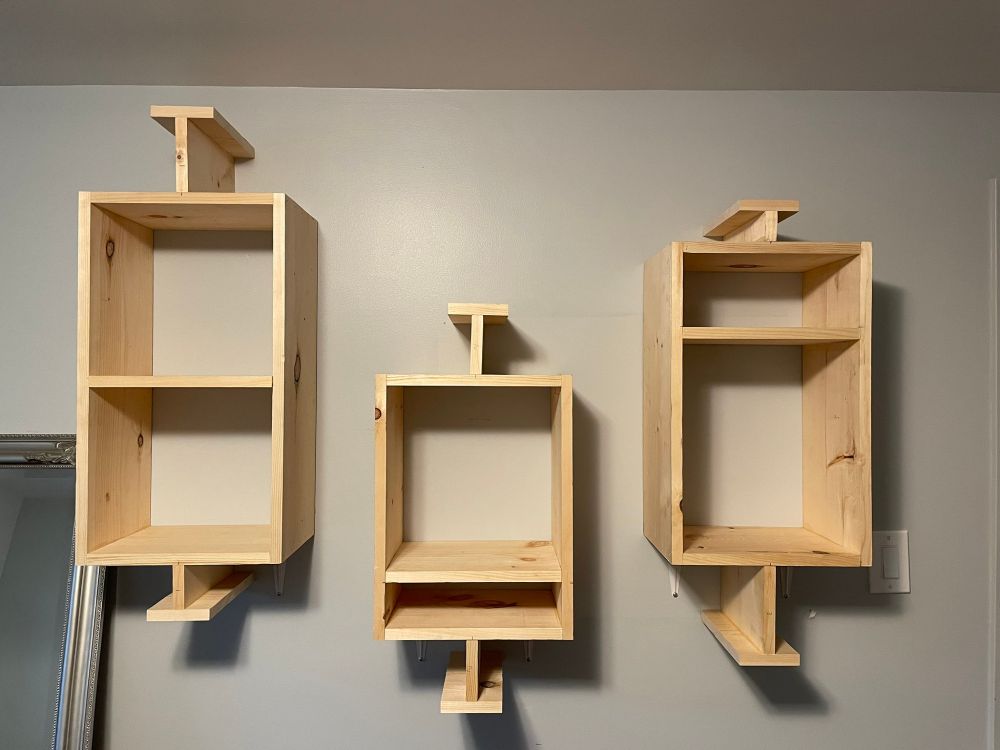
📊Looking to re-decorate your #dataviz office? Y
ou need Boxplot Shelves!
A set of three wall shelf sets, in the form of boxplots
Reposted by Lisa Hornung
revisual.co
Our website has a new chart gallery! 📈📊📉

You can now browse through almost every chart from all our projects & filter them by chart function. Whether you’d like to draw inspiration, explore our projects, or just because you love charts. Stop by revisual.co/chart-gallery/ & look around! 👀
Reposted by Lisa Hornung
nerik.bsky.social
In these turbulent times—while the galaxy reels from crisis to crisis—sometimes the only way forward… is sideways, into Star Wars canon. A timeline of every Star Wars show, charted in story-order from the dawn of the Republic to the First Order. #DarthJarJar #StarWars #MayThe4th #Andor #dataviz
Reposted by Lisa Hornung
alexselbyb.bsky.social
We have a "never use yellow if you can help it" rule for our charts. We couldn't help it on this one
www.economist.com/united-state...
Chart from The Economist showing the contribution to California's energy supply of natural gas, wind, hydro, batteries, nuclear and solar. There's a huge jump in solar from around 8am to 6pm
Reposted by Lisa Hornung
driven-by-data.net
Last week I had the pleasure of finally releasing the #SveltePlot alpha version during my talk at the #SvelteSummit in Barcelona. It's a new visualization framework for @svelte.dev that I've been working on for the past 18 months, so it's about time for a 🧵
SveltePlot logo with the website address https://svelteplot.dev and a few example plots in the background
lisahornung.bsky.social
Balancing fair wages with tight budgets is tricky. Independent pay reviews face criticism but remain crucial in weighing the complexity.

Beyond pay, other factors influence recruitment & retention, and a stronger long-term focus is needed.

Read more www.health.org.uk/reports-and-... 6/6
How much should NHS staff be paid?
Using data visualisation to analyse NHS pay and implications for policymakers.
www.health.org.uk
lisahornung.bsky.social
Strong start, slow growth: While recent nursing grads have high starting salaries and strong employment rates, they have lower earnings growth potential.

Their peers five years ahead only earn 11% more, compared to 50% for medical science or 72% for economics grads. 5/
Scatter plot showing employment rate and earnings growth potential 1 year after graduation by subject, 2021/22. Health graduates tend to have higher employment rates but lower earning growth potential. Source: DfE LEO  graduate and postgraduate outcomes, 2021/22. Earnings growth potential is calculated as % difference in earnings between students 1 year after graduation vs students 5 years after graduation in 2021/22.
lisahornung.bsky.social
There is also concern about a slowdown in applications for NHS professions. But despite the decline in real earnings, most #NHS graduates start with comparatively high earnings.

One year after graduating, doctors and nursing professionals earn above the average for other grads. 4/
Dumbell plot/connected dot plot showing median earnings by 1 year, 3 year and 5 year after graduation by subject group in 2021/22 (£k). Health graduates have some of the highest starting salaries (£29k 1 year after graduation) but this earning advantage erodes over time (£36k 5 years after graduation). Source: DfE LEO  graduate and postgraduate outcomes, 2021/22. Note subject group stats are weighted by student numbers.
lisahornung.bsky.social
Despite concerns that pay could hurt recruitment & retention, #NHS staffing surged between 2019–24.

+23% clinical staff
+18% consultants
+24% nurses & health visitors

Growth outpaced previous years, partly due to international recruitment, ~90% of new nurses (2019–23) came from abroad. 3/
Bar chart showing the total percentage change in FTE NHS staff numbers by group and 5-year period. Clinical staff numbers have increased faster in the past 5 years (23%) than in the previous decade (3%-8%). Source: NHS hospital and community health service staff monthly workforce statistics Nov 2024. Notes: Percentage change calculated between November each year
lisahornung.bsky.social
In 2024, the Labour govt agreed to a 5.5% increase for Agenda for Change staff & 6% for doctors, resident docs got an additional £1K.

📉 Despite these gains, #NHS wages remain up to 11% lower than in 2010 after inflation and lag behind the private and public sector as a whole. 2/
Bar chart showing the change in real-term earnings since 2010 after adjusting for inflation in 2024. Most NHS pay is lower in real terms in 2019 and remains behind the private (-1%) and public sector (-5%). Foundation doctors in year 2 and consultants have seen the biggest drop (-11%) while nurses and health visitors have seen their salaries fall by 8%. Source: NHS staff earnings estimates sep 2024, OBR's  CPIH Mar 2025. Averages weighted by headcount.
lisahornung.bsky.social
How much should #NHS staff be paid?

Only 32% of NHS staff are satisfied with their pay, a relatively consistent trend.

But what is the right rate for NHS jobs? How do you judge if people are over/underpaid?

A thread based on our latest analysis 📊👇 1/ www.health.org.uk/reports-and-...
Small multiple chart showing percentage of staff who are satisfied or very satisfied with their pay 2020 to 2024. Only a third (32%) of NHS staff are satisfied with their pay with medical and dental professionals the most content. Data source: NHS Staff survey national results 2024