


I speak about climate futures, mitigation and adaptation in the face of the climate crisis. 🇿🇦
I am a huge fan of ephemeral social media, so my posts delete after 60 days. Content that I want around longer will be on my blog.
https://peterdutoit.com ..
more
I speak about climate futures, mitigation and adaptation in the face of the climate crisis. 🇿🇦
I am a huge fan of ephemeral social media, so my posts delete after 60 days. Content that I want around longer will be on my blog.
https://peterdutoit.com
du Toit is an Afrikaans surname of French origin, originally from François du Toit, a Huguenot who moved to South Africa in 1686. It translates as "of the roof". People with the surname include:Alexander du Toit (1878–1948), South African geologist Anri du Toit aka Yolandi Visser, South African musician Braam du Toit, South African composer Christiaan du Toit (1901–1982), South African military commander Daniel du Toit (1871–1959), South African astronomer Dirk du Toit (1943–2009), South African politician Elize du Toit, South African born, British actress Flooi du Toit (1869–1909), South African cricketer Francois Jacobus du Toit (1897–1961), South African journalist and economist Gaffie du Toit, South African rugby union Jacob Daniël du Toit, South African poet and translator Jané du Toit, Namibian rugby union footballer Lydia Lindeque (1916–1997), South African actor Natalie du Toit, South African swimmer Nick du Toit, South African arms dealer Paul du Toit (1965–2014), South African artist Pieter-Steph du Toit, South African rugby union player Rachel Alida du Toit (1916–1997), South African actor Sarel Petrus du Toit (1864–1930), Second Boer War Boer general Simoné du Toit, South African shot putter Stephanus Jacobus du Toit (1847–1911), South African Afrikaans language pioneer Wikus du Toit, South African actor .. more

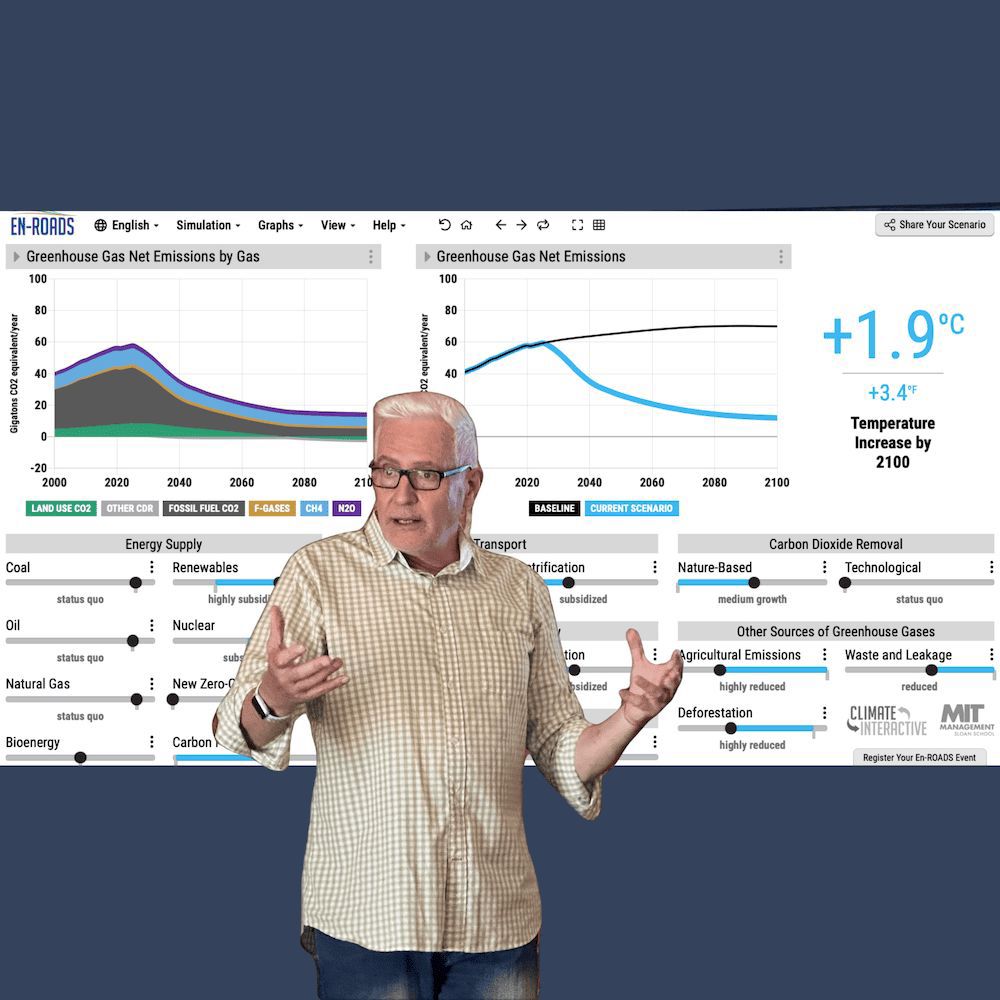
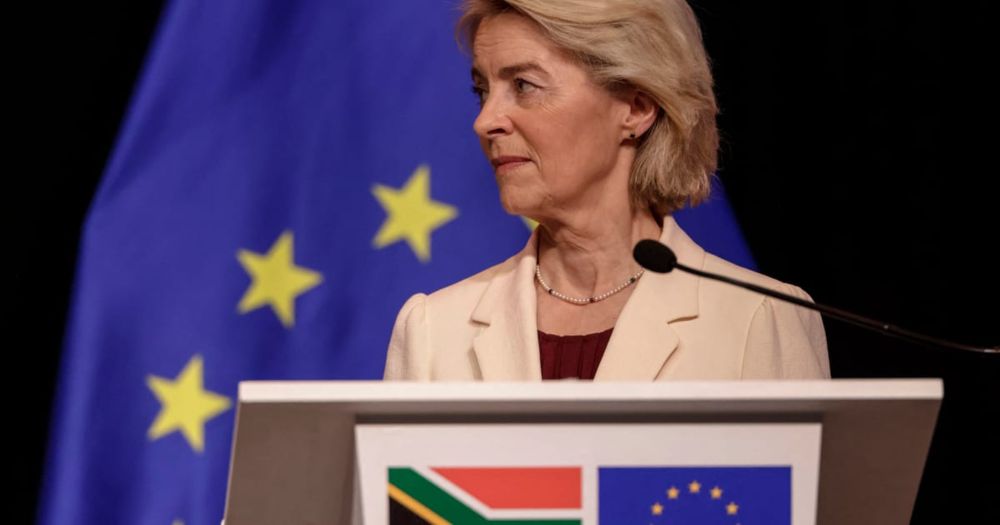
"Since atmospheric GHGs [which increased by +2.3% in 2024] drive global warming, [this is] ultimately the metric that matters for meeting the temperature goal of the Paris Agreement."
Unless these decline we are on a steady march to hell
#ClimateCrisis


🌡️ "The forecast indicates a strong global signal for enhanced probabilities of above-normal land surface temperatures."
🌧️ "Overall, the DJF 2025/26 rainfall outlook reflects a La Niña-influenced pattern"
Source: wmo.int/media/update...

2024 emissions increased by 2.3% from 2023.
2025 emissions are projected to increase by 1.1% from 2024

UNEP (2025): "Since atmospheric GHG concentrations drive global warming, these are ultimately the metrics that matter for meeting the temperature goal of the Paris Agreement."
If these are not curbed we are on a highway to hell.

Reposted by Du Toit

www.technosphere.earth/living-beyon...

Today they had to switch off the river extraction pumps due to extreme low water flow.
Knysna has been plagued by municipal mismanagement and infrastructure issues and the drought has amplified all this.
Population: 98,000
Reposted by Du Toit, David Johnson


Did the talks succeed or fail? The verdict must take account of the geopolitical minefield in which they took place
Jonathan Watts in Belém
www.theguardian.com/environment/...
There are early signs of this everywhere, right now Iran seems to be a hotspot at ~1.5ºC of heating
We are *utterly* unprepared for what comes at 1.6, 1.7 & 2ºC

Forewarned is forearmed.
peterdutoit.com/cons...
#ClimateCrisis #RealityCheck
Reposted by Dorothy Bishop, Du Toit

As I wrote before, President Masoud Pezeshkian himself said that it might be necessary to relocate Tehranis in large number.” open.substack.com/pub/peterfra...

www.reuters.com/sust...
#COP30
Reposted by Du Toit, Stacy D. VanDeveer
Stop burning #fossilfuels. Stop turning them into plastics.
Leave them in the ground.
“A climate text that cannot mention fossil fuels is a climate text that refuses to speak the truth…”
Part 1:

theconversation.com/the-world-lo...
Reposted by Mark Lubell

They are ALREADY experiencing saltwater intrusion into wells, coastal erosion, and have begun the early relocation of at-risk communities.
Yet many nations just don't care about their plight. They just want to keep burning fossil fuels.
Disgraceful.

Fossil fuels and atmospheric pollution are inseparable.
There is no “clean” coal
There is no “clean” oil
There is no “clean” methane gas
Want to stop the pollution? Then stop burning fossil fuels! Period.
Don’t be sidetracked by spin that pretends otherwise!
Reposted by Du Toit
For @thepointau.bsky.social, I decided to do the unthinkable and just actually check whether Australia's gas exports are being a magical climate solution and displacing shittonnes of Asian coal
You know what I found, but you will enjoy me saying it:
thepoint.com.au/opinions/251...
Reposted by Du Toit


#ClimateCrisis #Heatwaves
Reposted by Du Toit

Reposted by Du Toit


For those willing to confront reality:
The IPCC is perfectly clear on the need to strand the majority of fossil fuel assets in order to meet the goals of the Paris Agreement
Also available on Substack: jimehansen.substack.com/p/warning-th...

2°C climate chaos will be unlike anything we have experienced until now.
Adaptation conversations now beyond urgent