


Urban Carmel
@ukarlewitz.bsky.social
Former: UBS Securities, Asia Ex-Pat, McKinsey, Mayor of Mill Valley, Finance Twitter. Fan of causal relationships, behavioral finance and the Quad Dipsea.
Pinned
Urban Carmel
@ukarlewitz.bsky.social
· Nov 13
1. There’s no PPT
2. The Fed has been hated for 110 years
3. High probabilities do not imply certainty
4. It can always be different this time
5. Things go up over time
6. We’re not all going to agree
2. The Fed has been hated for 110 years
3. High probabilities do not imply certainty
4. It can always be different this time
5. Things go up over time
6. We’re not all going to agree
It's the 9th trading day of December when indices are supposed to be at their low. RUT is +3.6%, DJIA is +2.1% and SPX is +1% so far. All are at new ATHs. The good part starts tomorrow?

December 11, 2025 at 9:53 PM
It's the 9th trading day of December when indices are supposed to be at their low. RUT is +3.6%, DJIA is +2.1% and SPX is +1% so far. All are at new ATHs. The good part starts tomorrow?
I think Tom is very good but I wouldn't take him (or anyone) too literally. He expected 2025 1H would scream higher and 2H would be a reset: the opposite happened, with a near bear in 1H. At the year's mid-point, he then expected another 10% drop in 2H: nope.

Ivan is correct, Tom Lee thinks we can swoon 20% midyear 2026.
And then a screamer into year end
Interesting.
And then a screamer into year end
Interesting.

Did Tom Lee just say we could have a bear market during 2026?
December 11, 2025 at 9:37 PM
I think Tom is very good but I wouldn't take him (or anyone) too literally. He expected 2025 1H would scream higher and 2H would be a reset: the opposite happened, with a near bear in 1H. At the year's mid-point, he then expected another 10% drop in 2H: nope.
Dow transports on track for ATH weekly close. Dow Industrials at a new ATH today. Dow Theorists rejoice

December 11, 2025 at 9:27 PM
Dow transports on track for ATH weekly close. Dow Industrials at a new ATH today. Dow Theorists rejoice
This is an example of the Gambler's Fallacy, the belief that random, independent events somehow "balance out". The market does not have a "memory" that forces it to go up simply because it has gone down twice before.

December 7, 2025 at 8:28 PM
This is an example of the Gambler's Fallacy, the belief that random, independent events somehow "balance out". The market does not have a "memory" that forces it to go up simply because it has gone down twice before.
Ohio State, with a roster cost more than 50% greater, losing to Indiana, who won their first outright title since 1945, is one for the ages
Highest college football spending (NIL + head coach). Congrats to Ohio State for outspending Michigan by 50% to win yesterday’s game. The best that can be said is Ohio got its moneys worth (unlike Texas). From Gemini

December 7, 2025 at 4:13 PM
Ohio State, with a roster cost more than 50% greater, losing to Indiana, who won their first outright title since 1945, is one for the ages
I agree. Like everything else, never seems like the right time to buy but in hindsight it looks easy
I keep hearing how awful it is for youngsters now but I recall it was not exactly affordable when I was that age. Now we have data to prove it.

Housing affordability is about where it was in 2022 and 2006 (and the late 1980s).
Was far worse in the first half of the '80s @yardeni.
2011-2013 was the golden age to be a buyer.
yardeni.com/charts/h...
Was far worse in the first half of the '80s @yardeni.
2011-2013 was the golden age to be a buyer.
yardeni.com/charts/h...
December 4, 2025 at 9:21 PM
I agree. Like everything else, never seems like the right time to buy but in hindsight it looks easy
You could add that there has historically been a long lag between europhia and the eventual market top. Again, investors should never assume that there's a tidy symmetry between sentiment at tops and bottoms. Investors get bearish all at once (bottom) but can remain bullish during long uptrends

December 4, 2025 at 9:05 PM
You could add that there has historically been a long lag between europhia and the eventual market top. Again, investors should never assume that there's a tidy symmetry between sentiment at tops and bottoms. Investors get bearish all at once (bottom) but can remain bullish during long uptrends
Initial UE claims this week 191k. It has basically never been this low. In the 50 yrs before COVID, it cracked under 200k only once. In the ~9-mo heading into a recession, claims have historically been on the rise and above 300k. So there's that

December 4, 2025 at 2:57 PM
Initial UE claims this week 191k. It has basically never been this low. In the 50 yrs before COVID, it cracked under 200k only once. In the ~9-mo heading into a recession, claims have historically been on the rise and above 300k. So there's that
Yes, $IYT at a new ATH while heavy truck sales and freight tonnage at/near 5-year lows is exciting
December 3, 2025 at 8:41 PM
Yes, $IYT at a new ATH while heavy truck sales and freight tonnage at/near 5-year lows is exciting
Sales down 25.2% yoy and down 13.2% YTD through November. Usually, heavy truck sales decline sharply prior to a recession, and sales have collapsed recently.

Heavy Truck Sales Collapsed in October and November
www.calculatedriskblog.com/2025/12/heav...
www.calculatedriskblog.com/2025/12/heav...

Heavy Truck Sales Collapsed in October and November
This graph shows heavy truck sales since 1967 using data from the BEA. The dashed line is the November 2025 seasonally adjusted annual sales...
www.calculatedriskblog.com
December 3, 2025 at 7:53 PM
Sales down 25.2% yoy and down 13.2% YTD through November. Usually, heavy truck sales decline sharply prior to a recession, and sales have collapsed recently.
$IYT transportation ETF. Knocking on the door of a new ATH for the first time in a year. You know what they say, 8th time is the charm

December 2, 2025 at 11:12 PM
$IYT transportation ETF. Knocking on the door of a new ATH for the first time in a year. You know what they say, 8th time is the charm
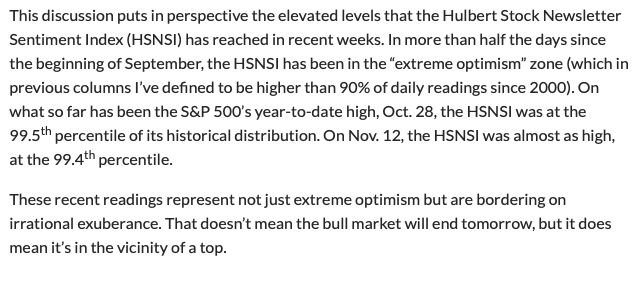
Mark Hulbert: "Good Bye Bull Market" in today's Market Watch.
"So while there are plenty of signs of irrational exuberance in the stock market, contrarians don’t know if the top will occur in the next several weeks, in 2026 or if it already happened in October." www.marketwatch.com/story/goodby...
"So while there are plenty of signs of irrational exuberance in the stock market, contrarians don’t know if the top will occur in the next several weeks, in 2026 or if it already happened in October." www.marketwatch.com/story/goodby...


December 2, 2025 at 8:39 PM
Mark Hulbert: "Good Bye Bull Market" in today's Market Watch.
"So while there are plenty of signs of irrational exuberance in the stock market, contrarians don’t know if the top will occur in the next several weeks, in 2026 or if it already happened in October." www.marketwatch.com/story/goodby...
"So while there are plenty of signs of irrational exuberance in the stock market, contrarians don’t know if the top will occur in the next several weeks, in 2026 or if it already happened in October." www.marketwatch.com/story/goodby...
Highest college football spending (NIL + head coach). Congrats to Ohio State for outspending Michigan by 50% to win yesterday’s game. The best that can be said is Ohio got its moneys worth (unlike Texas). From Gemini
November 30, 2025 at 6:06 PM
Highest college football spending (NIL + head coach). Congrats to Ohio State for outspending Michigan by 50% to win yesterday’s game. The best that can be said is Ohio got its moneys worth (unlike Texas). From Gemini
$SPX up 7 mo in a row. N=16 since 1950. All closed higher within 5 mo. 1980 rose 8 mo in a row and then it was straight downhill until 1982. From Subutrade

November 28, 2025 at 8:55 PM
$SPX up 7 mo in a row. N=16 since 1950. All closed higher within 5 mo. 1980 rose 8 mo in a row and then it was straight downhill until 1982. From Subutrade
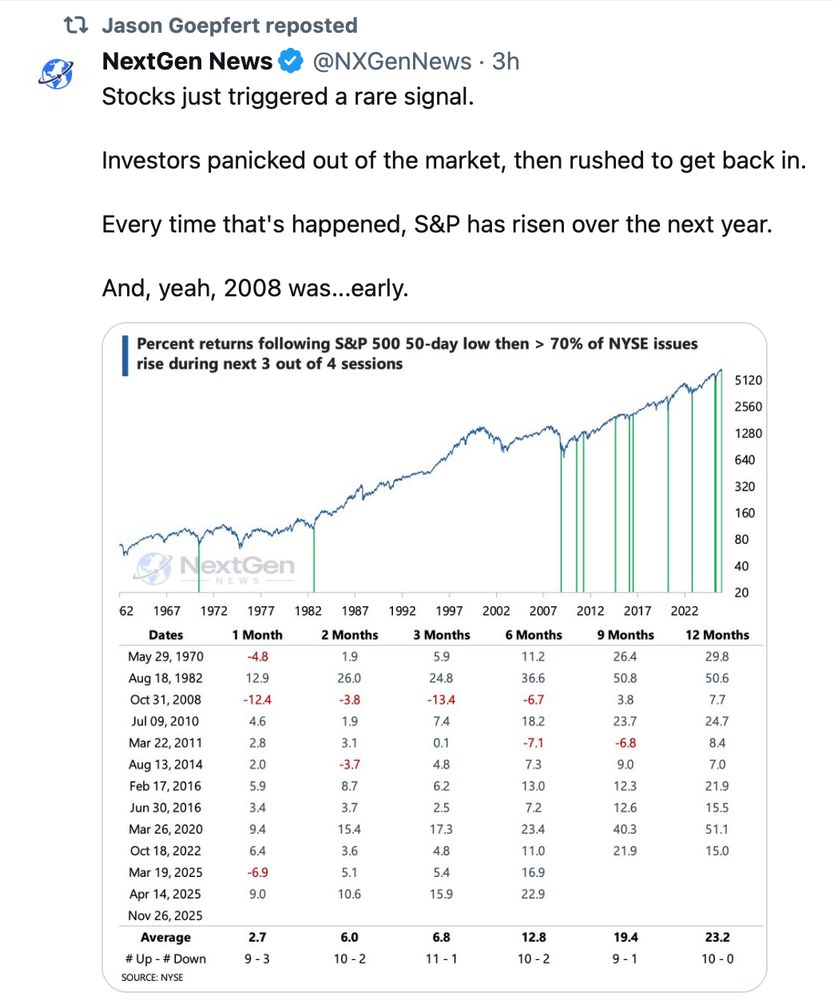
50-d low and then >70% A/D issues within 4 days. N=13 in the past 55 years of which 3 happened this year. From NXGenNews
November 27, 2025 at 12:29 AM
50-d low and then >70% A/D issues within 4 days. N=13 in the past 55 years of which 3 happened this year. From NXGenNews
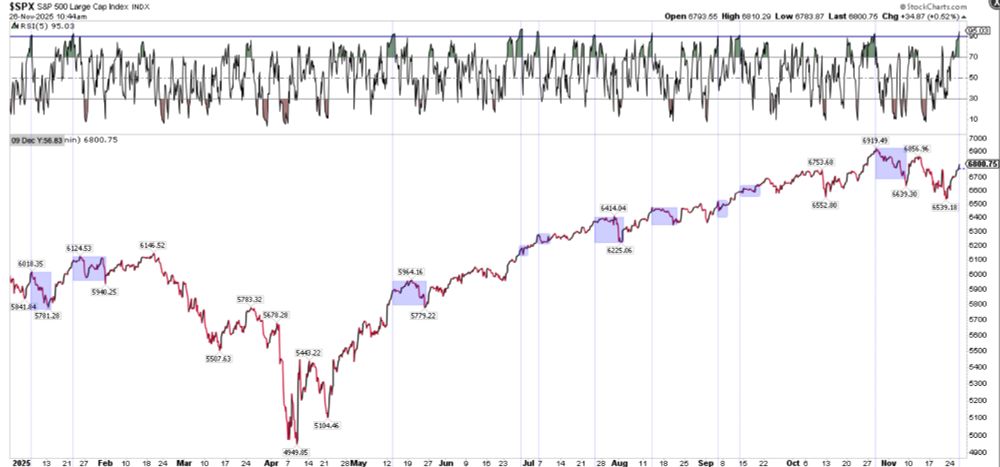
$SPX 60' RSI(5) = 95. Turkey might be getting a little overcooked. Similar in past 11-months highlighted.
November 26, 2025 at 3:50 PM
$SPX 60' RSI(5) = 95. Turkey might be getting a little overcooked. Similar in past 11-months highlighted.
So far, banks' 2026 YE targets are a median of 7600, about 11% higher than today's level. If you're a strategist, this target makes sense: since 1980, the market is up on the year nearly 80% of the time by an average of 11%. Table from Gemini

November 26, 2025 at 3:05 PM
So far, banks' 2026 YE targets are a median of 7600, about 11% higher than today's level. If you're a strategist, this target makes sense: since 1980, the market is up on the year nearly 80% of the time by an average of 11%. Table from Gemini
UE claims 216k this week. Comment below from a year ago still applies
UE claims only 219k this week. The last time UE was this low within 6-9 mo of a recession was more than 50 years ago when spending on a war in Vietnam and oil embargos caused persistent inflation. The labor force was half the size of today's.

November 26, 2025 at 2:47 PM
UE claims 216k this week. Comment below from a year ago still applies
Gemini 3: provide a chart of the cost of a turkey (per lbs) and the cost of a typical Thanksgiving meal for the past 11 years


November 26, 2025 at 2:31 PM
Gemini 3: provide a chart of the cost of a turkey (per lbs) and the cost of a typical Thanksgiving meal for the past 11 years
September real retail sales +1.2% yoy, ex-gas +1.3% yoy. Retail sales are at the level you'd expect them to be if the Covid shock had never occurred

November 26, 2025 at 3:01 AM
September real retail sales +1.2% yoy, ex-gas +1.3% yoy. Retail sales are at the level you'd expect them to be if the Covid shock had never occurred
Buy today's close, 17 of 18 closed higher by end of week. Folks like Thanksgiving

If Mon & Tues close higher does that kill the Wed-Fri Thanksgiving bullish edge? Nope. I'll be discussing this study and more in tonight's letter. Also...Black Friday sale coming later this week so it might be a good time to take a free trial: quantifiableedges.com/subscribers/... $SPY $SPX

November 25, 2025 at 8:27 PM
Buy today's close, 17 of 18 closed higher by end of week. Folks like Thanksgiving
Strong gains YTD but a down November has historically been followed by gains in December. Why? Momentum doesn't reverse on a dime.
bsky.app/profile/carl...
bsky.app/profile/carl...

“.. I looked back at bullish $SPX years through November-end (when SPX was +10% or more YTD) AND when November was a down month.
I found the December column interesting …”
- B of A desk
I found the December column interesting …”
- B of A desk

November 24, 2025 at 2:38 PM
Strong gains YTD but a down November has historically been followed by gains in December. Why? Momentum doesn't reverse on a dime.
bsky.app/profile/carl...
bsky.app/profile/carl...
Breadth via ZBT oversold (lower panel) but yet a thrust (buy signal) while $SPX still above its 200-d. Many followed by short term bounce (Feb 2023 lost another 3%) and/or longer term buy signal (not Jan 2022). Overall, good but not great.

November 23, 2025 at 7:58 PM
Breadth via ZBT oversold (lower panel) but yet a thrust (buy signal) while $SPX still above its 200-d. Many followed by short term bounce (Feb 2023 lost another 3%) and/or longer term buy signal (not Jan 2022). Overall, good but not great.
Good lists, although it’s missing a favorite @dow.bsky.social

Follow the starter packs:
Investing go.bsky.app/Qn6r8WD
Econ go.bsky.app/Q3Vt4ef
Ritholtz All Stars go.bsky.app/K7pijeB
Investing go.bsky.app/Qn6r8WD
Econ go.bsky.app/Q3Vt4ef
Ritholtz All Stars go.bsky.app/K7pijeB
bsky.app
November 22, 2025 at 8:19 PM
Good lists, although it’s missing a favorite @dow.bsky.social
See how long it takes for my copy cat to repost these charts as his own on X
November 21, 2025 at 12:24 AM
See how long it takes for my copy cat to repost these charts as his own on X