Alex Albright
@allbriteallday.bsky.social
1.6K followers
1.2K following
71 posts
Economist @ Minneapolis Fed's Opportunity & Inclusive Growth Institute. There's a graph for that. Views are my own. (she/her) https://albrightalex.com/
Posts
Media
Videos
Starter Packs
Reposted by Alex Albright


Reposted by Alex Albright

Reposted by Alex Albright


Reposted by Alex Albright


Reposted by Alex Albright

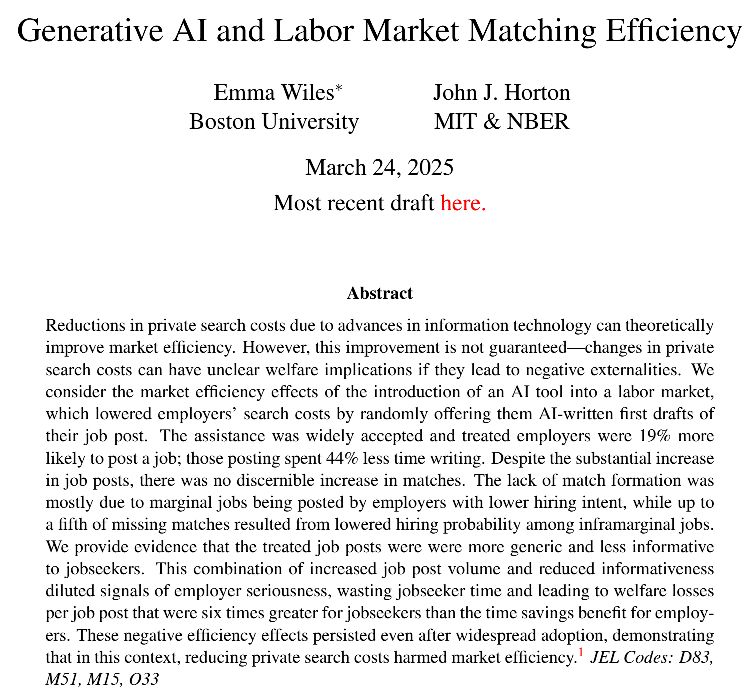
Emma Wiles
@emmawiles.bsky.social
· Mar 24
Reposted by Alex Albright


Alex Albright
@allbriteallday.bsky.social
· Apr 14

Reposted by Alex Albright

Reposted by Alex Albright


Reposted by Alex Albright

Reposted by Alex Albright


Reposted by Alex Albright

Alex Albright
@allbriteallday.bsky.social
· Feb 20


Reposted by Alex Albright

Christian Traxler
@chtraxler.bsky.social
· Jan 29
Reposted by Alex Albright

Reposted by Alex Albright


Reposted by Alex Albright

Reposted by Alex Albright