Jesper N. Wulff
@jnwulff.bsky.social
660 followers
950 following
37 posts
Professor @AarhusUni doing research on organizational research methods and teaching deep neural networks in our Msc. BI program. https://sites.google.com/view/jesperwulff/bio
Posts
Media
Videos
Starter Packs

Reposted by Jesper N. Wulff


Reposted by Jesper N. Wulff


Reposted by Jesper N. Wulff

Reposted by Jesper N. Wulff


Reposted by Jesper N. Wulff


Reposted by Jesper N. Wulff


Reposted by Jesper N. Wulff

Dr. Casey Fiesler
@cfiesler.bsky.social
· Aug 23
Reposted by Jesper N. Wulff

![CRISPR as a microbial immune system
In 2003, Mojica wrote the first paper suggesting that CRISPR was an innate microbial immune system. The paper was rejected by a series of high-profile journals, including Nature, Proceedings of the National Academy of Sciences, Molecular Microbiology and Nucleic Acids Research, before finally being accepted by Journal of Molecular Evolution in February, 2005.[3][4]](https://cdn.bsky.app/img/feed_thumbnail/plain/did:plc:73aicoale2mqwrap63rdzwep/bafkreibu3dburfn527r3sbu2ov6y7gebv6zopaznagnfytjtsn6y4k7cs4@jpeg)
Reposted by Jesper N. Wulff
Reposted by Jesper N. Wulff


Reposted by Jesper N. Wulff

Zeta Of 1
@zetaof1.bsky.social
· Aug 4
Reposted by Jesper N. Wulff


Jesper N. Wulff
@jnwulff.bsky.social
· Aug 1
Reposted by Jesper N. Wulff

Reposted by Jesper N. Wulff

Reposted by Jesper N. Wulff

Dr. Cat Hicks
@grimalkina.bsky.social
· Jul 13
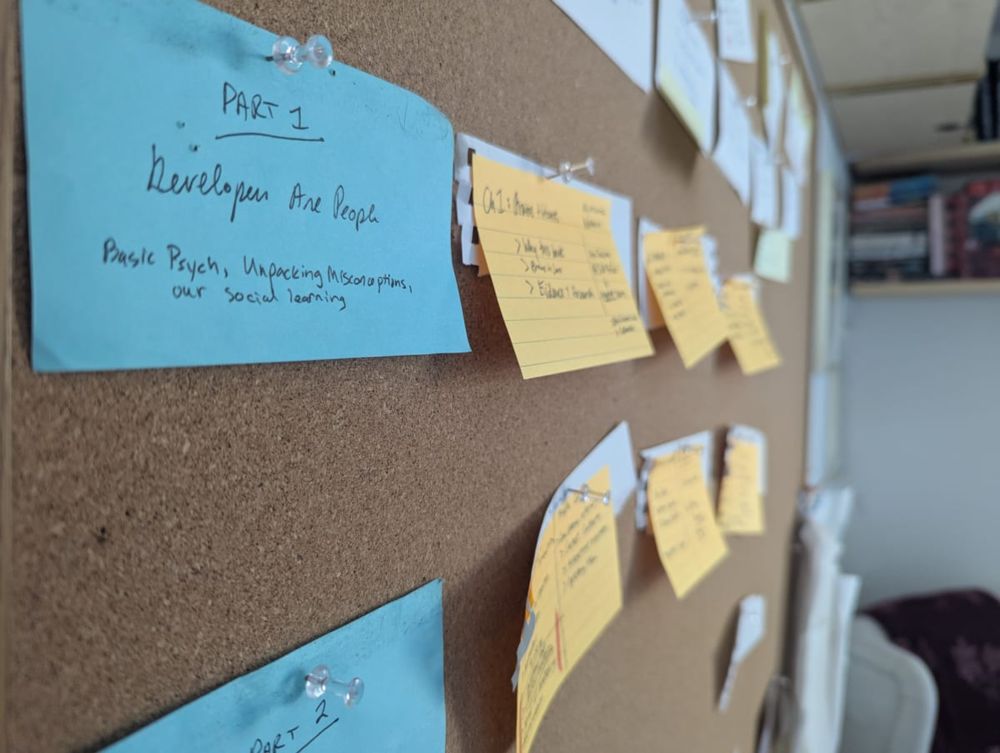
Are developers slowed down by AI? Evaluating an RCT (?) and what it tells us about developer productivity
Seven different people texted or otherwise messaged me about this study which claims to measure “the impact of early-2025 AI on experience open-source developer productivity.”
You know, when I decide...
www.fightforthehuman.com
Reposted by Jesper N. Wulff