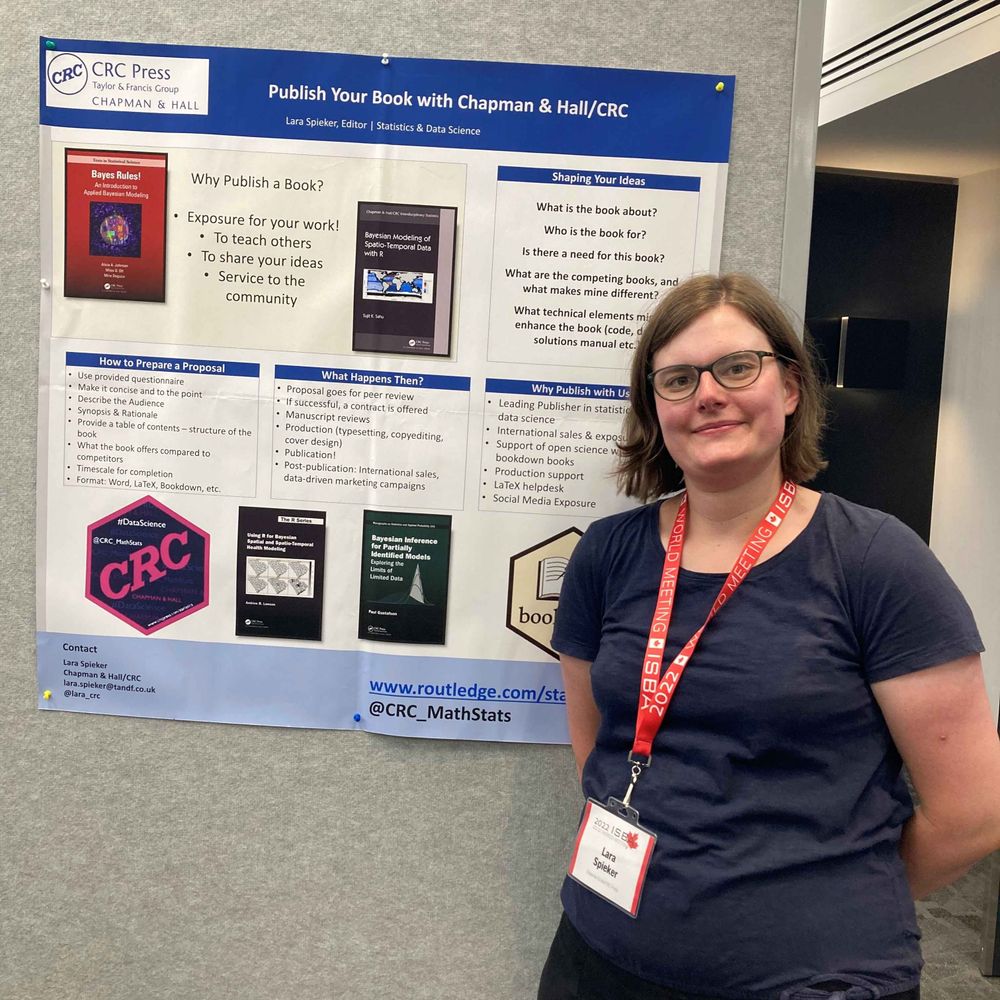
Lara
@laracrc.bsky.social
500 followers 880 following 23 posts
Editor for #Statistics, #RStats and #DataScience books at Chapman & Hall/CRC Press. The usual caveats apply, views are my own. https://www.routledge.com/statistics
Posts Media Videos Starter Packs
Reposted by Lara
alexselbyb.bsky.social
In honour of today being the second-most-popular day to be birthed, here's my second-favourite birthday distribution chart
Line chart showing daily births. September 26th has the highest number, December 25th and 26th have the lowest. Source: ONS births in England and Wales data
laracrc.bsky.social
Lovely to see all the books from the series💚 @clairemkbowen.bsky.social @johnbailer.bsky.social
amstatnews.bsky.social
ASA’s Ron Wasserstein shares exciting news from ASA headquarters—new titles in the ASA-CRC Series on Statistical Reasoning in Science and Society have arrived! Watch his video to learn more and then explore these books that show how statistics shapes our world: tinyurl.com/4psncp6b
Reposted by Lara
nrennie.bsky.social
There was lots of data to play with for #TidyTuesday this week where we're looking at the power of different passports! ✈️

I decided to try out the idea of using small multiples and highlighting to untangle a spaghetti chart with lots of lines 📊

#RStats #DataViz #ggplot2
Chart showing how rankings of passports have changed over time, split by region with top one in each highlighted. European are ranked high, and UAE has had a dramatic rise.
Reposted by Lara
cvidonne.bsky.social
Inspired by @nrennie.bsky.social excellent #TidyTuesday plot on the power of passports, I adapted the idea to look at refugee origins.

This chart ranks countries of origin of refugees, asylum-seekers, and others in need of international protection, grouped by region.

#RStats #ggplot2 #Refugees
Bump chart faceted by world regions showing the top countries of origin of refugees, asylum-seekers, and others in need of international protection. Asia and Africa rank consistently high, driven by long-term crises such as Afghanistan and Sudan. The Americas and Europe also appear high due to more recent crises in Venezuela and Ukraine.
Reposted by Lara
Reposted by Lara
mrcctu.bsky.social
September is #GynaecologicalCancerAwarenessMonth.

#OvarianCancer is the most devastating gynaecological cancer in the UK.

The UKCTOCS trial involved over 200,000 women to explore if screening could save lives, but it wasn’t without challenges.

🎧 Discover the insights in this #TrialTalk episode:
Lessons from UKCTOCS, a large-scale trial in ovarian cancer screening
UKCTOCS (UK Collaborative Trial of Ovarian Cancer Screening) is one of the largest screening trials in ovarian cancer. More than 200,000 women from England, Wales and Northern Ireland took part in it,
buff.ly
Reposted by Lara
nrennie.bsky.social
I'm really looking forward to this session!

Some of the things I'll be talking about include:

📖 Writing about #RStats with #QuartoPub
✍️ Working with @laracrc.bsky.social at CRC Press
📊 How it all started with some #TidyTuesday charts!

#StatsEd #DataViz
profandyfield.com
Excited to participate in 'Book Publication as a Scholarly Activity for Statisticians ...' @ 11.30 on Thurs 4 Sept @royalstatsoc.bsky.social conference with Margaret MacDougall, @nrennie.bsky.social and Rhys Jones. We'll be sharing publication experiences & answering Q's! @rss-teach.bsky.social
Reposted by Lara
nrennie.bsky.social
At @royalstatsoc.bsky.social conference next week, I'll be talking in the 'Book Publication as a Scholarly Activity for Statisticians' session @ 11.30 on Thu 4 Sep - which I'm really excited about!

(Very subtle announcement that there's a #DataViz book from me coming soon!)

#StatsEd #RSS2025Conf
Screenshot of slides showing my first and a more recent TidyTuesday visualisation
Reposted by Lara
nrennie.bsky.social
For this week's #TidyTuesday data about Billboard Hot 100 Number Ones, I decided to make a sheet music-themed chart 📊 - that will probably manage to annoy #DataViz people as much as music people! 🎶

Thanks to @jenrichmondphd.bsky.social for curating the data!

#RStats #ggplot2
Chart styled to look like sheet music showing the happiness scores of funk and soul songs, by male/female/mixed songwriting teams. A cluster of happy songs by male songwriters is seen in the mid-1970s.
Reposted by Lara
johnbailer.bsky.social
Just in time for the start of a new school year - a podcast discussion of evaluating student success. Also check out other Stats+Stories education-related #podcast episodes #EduSky
statsandstories.net/education
Reposted by Lara
datavisfriendly.bsky.social
CRAN: "thanks, package heplots_1.7.8.tar.gz is on its way to CRAN!"

Added a distancePlot(), a very nice diagnostic plot for multivariate linear models.Shows leverage & outliers together
in a way that shows both problems.

See: friendly.github.io/heplots/
For a multivariate regression model, this is a plot of Mahalanobis distances of the predictor variables (~ leverage) against Mahalanobis distances of the residuals (large -> outliers)
laracrc.bsky.social
Happy Friday 🌍! We are giving away one copy of 'Spatial Linear Models for Environmental Data'. To enter, simply follow me and re-post this by the end of Sunday, August 17. #spatial #environment # #data #StatsSky routledge.com/9780367183349 not associated with bsky
Book cover of Spatial Linear Models for Enviornmental Data, dark blue background with white pattern with a picture of caribou and data plots
laracrc.bsky.social
That's good to hear, I hope you enjoy the book (in full colour) :)
laracrc.bsky.social
So sorry about that too - would you mind dropping me an email with the details ([email protected]) and I can look into getting a replacement copy for you?
laracrc.bsky.social
So sorry to hear you got a faulty copy - could you please drop me an email ([email protected]) and I can get a replacement (colour!) copy sent out to you?
Reposted by Lara
emilhvitfeldt.bsky.social
some light teasing for an upcoming quarto revealjs plugin I have been working on
Reposted by Lara
paulnaish.bsky.social
Taylor 🐿️ & Francis 🦔 are enjoying hanging out at their booth at #MathFest2025!

@joinmaa.bsky.social @tandfresearch.bsky.social
Reposted by Lara
nowosad.fosstodon.org.ap.brid.gy
📍 Registration is open for Spatial Data Science across Languages (SDSL) 2025 – Sept 17–18 (+19), Salzburg, Austria.

Connect R, Python, Julia & more in spatial science.

🔗 https://forms.gle/E9fpG88V2VQQKmjk9 -- Apply for on-site by mid-July – limited spots […]

[Original post on fosstodon.org]
Reposted by Lara
paulnaish.bsky.social
Beauty in/of mathematics: tessellations and their formulas

@tandfresearch.bsky.social #mathart #tessellations www.tandfonline.com/doi/full/10....
laracrc.bsky.social
Congratulations!
Reposted by Lara
royalstatsoc.bsky.social
📣 Call for discussion papers

We are inviting submissions of papers on the innovative usages of causal natural experiments in statistics and data science

📆 Submit your abstract by 6 June

rss.org.uk/news-publica...
Reposted by Lara
Reposted by Lara
jonthegeek.com
Curator: @libbyheeren.bsky.social
@dslc.io welcomes you to week 19 of #TidyTuesday! We're exploring Seismic Events at Mount Vesuvius!

📂 https://tidytues.day/2025/2025-05-13
🗞️ https://www.ingv.it/somma-vesuvio

#RStats #PyData #JuliaLang #DataViz #tidyverse #r4ds
Logo for the #TidyTuesday Project. The words TidyTuesday, A weekly data project from the Data Science Learning Community (dslc.io) overlaying a black paint splash. TidyTuesday is a weekly social data project. All are welcome to participate! Please remember to share the code used to generate your results!
TidyTuesday is organized by the Data Science Learning Community. Join our Slack for free online help with R and other data-related topics, or to participate in a data-related book club!

 How to Participate
Data is posted to social media every Monday morning. Follow the instructions in the new post for how to download the data.
Explore the data, watching out for interesting relationships. We would like to emphasize that you should not draw conclusions about causation in the data.
Create a visualization, a model, a shiny app, or some other piece of data-science-related output, using R or another programming language.
Share your output and the code used to generate it on social media with the #TidyTuesday hashtag. Map of Mount Vesuvius region from the GOSSIP website showing seismic activity. The map displays numerous colored dots concentrated mainly on the volcano, with red and orange circles indicating more recent events clustered around the crater area. Green circles represent older seismic events, while yellow triangles mark monitoring stations surrounding the volcano. The larger the circles, the stronger the seismic activity.