
Lianglong Sun
@longonga.bsky.social
49 followers
110 following
16 posts
PhD candidate in Neuroscience at Beijing Normal University.
Posts
Media
Videos
Starter Packs


Reposted by Lianglong Sun


Reposted by Lianglong Sun

Lucina Uddin
@lucinauddin.bsky.social
· May 28
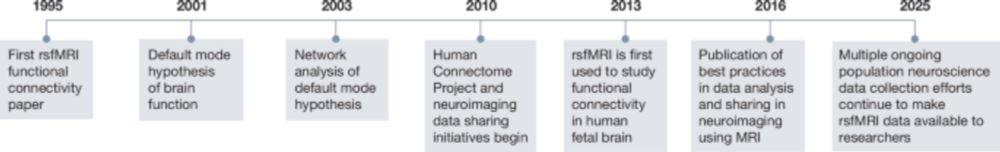
The history and future of resting-state functional magnetic resonance imaging - Nature
This Review provides an overview of the history of resting-state functional MRI research, which has helped to reveal the spatiotemporal organization of the brain, and discusses how it can contribute f...
www.nature.com


Lianglong Sun
@longonga.bsky.social
· Jun 21


Lianglong Sun
@longonga.bsky.social
· Jun 21
Lianglong Sun
@longonga.bsky.social
· Jun 21
Lianglong Sun
@longonga.bsky.social
· Apr 9

Lianglong Sun
@longonga.bsky.social
· Apr 5
Lianglong Sun
@longonga.bsky.social
· Apr 4


Lianglong Sun
@longonga.bsky.social
· Apr 4
Lianglong Sun
@longonga.bsky.social
· Apr 4
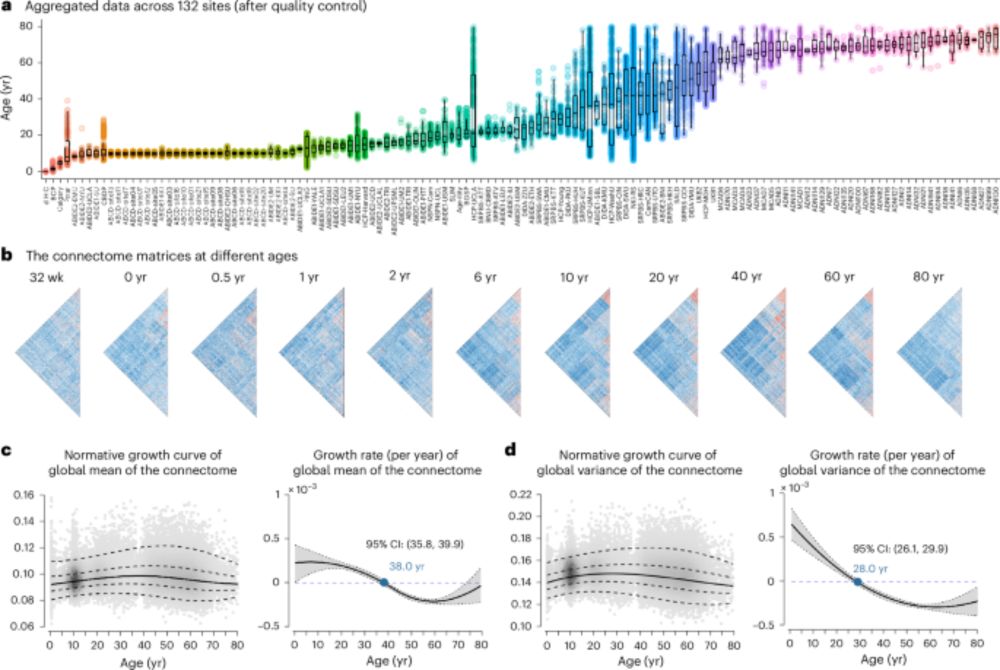
Human lifespan changes in the brain’s functional connectome - Nature Neuroscience
Sun et al. report human lifespan changes in the brain’s functional connectome in 33,250 individuals, which highlights critical growth milestones and distinct maturation patterns and offers a normative...
www.nature.com