


Måns Thulin
@mansthulin.bsky.social
I work in statistics and AI. Consultant, teacher, researcher. #Rstats user.
Book: https://modernstatisticswithr.com
Homepage: https://mansthulin.se
Co-founder of https://aireview.se
Book: https://modernstatisticswithr.com
Homepage: https://mansthulin.se
Co-founder of https://aireview.se
Pinned
Måns Thulin
@mansthulin.bsky.social
· Nov 19

Looking for a book that covers both statistics and R programming? Check out my book Modern Statistics with R! Coding, visualisation, regression, ML & more.
📖 Read it for free: www.modernstatisticswithr.com
📚 Get printed copies: tinyurl.com/mswrbook
#Rstats #statistics #datascience #machinelearning
📖 Read it for free: www.modernstatisticswithr.com
📚 Get printed copies: tinyurl.com/mswrbook
#Rstats #statistics #datascience #machinelearning
Reposted by Måns Thulin

We need to have a conversation about random seeds. Don't use 42.
blog.genesmindsmachines.com/p/if-your-ra...
blog.genesmindsmachines.com/p/if-your-ra...
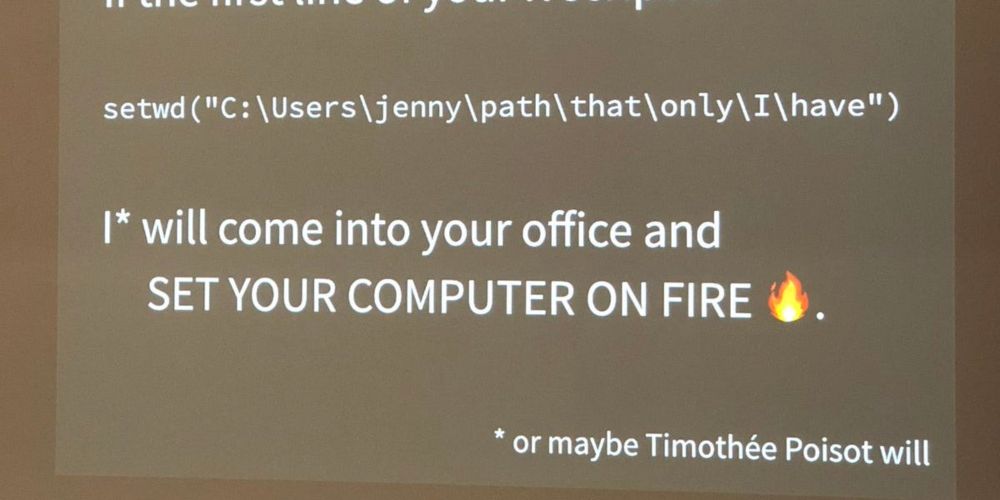
If your random seed is 42 I will come to your office and set your computer on fire🔥
Figuratively. More likely you'll get a stern talking to.
blog.genesmindsmachines.com
October 22, 2025 at 12:49 PM
We need to have a conversation about random seeds. Don't use 42.
blog.genesmindsmachines.com/p/if-your-ra...
blog.genesmindsmachines.com/p/if-your-ra...
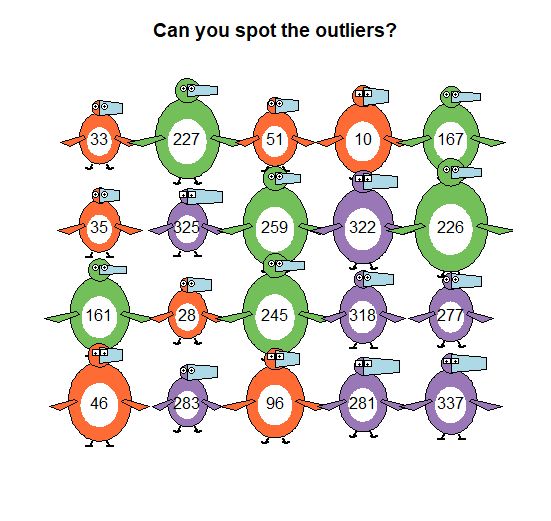
Chernoff faces for penguins. 🐧 This made my day.

October 13, 2025 at 11:10 AM
Chernoff faces for penguins. 🐧 This made my day.
A short tutorial on how to create gt cross-tables in one line of code using the #Rstats package ivo.table:
mansthulin.se/posts/ivotab...
mansthulin.se/posts/ivotab...

October 9, 2025 at 9:17 AM
A short tutorial on how to create gt cross-tables in one line of code using the #Rstats package ivo.table:
mansthulin.se/posts/ivotab...
mansthulin.se/posts/ivotab...
Happy to hear this. Positron certainly has its merits, but I think RStudio is a much better choice for the quiet majority who use #Rstats for statistical analyses rather than software engineering.

Is #Positron going to replace #RStudio? 😱 (This is the worry I keep hearing lately 👀)
Posit Software Architect @jmcphers.bsky.social says, "there are certainly no plans to get rid of RStudio."
Watch the full #DSHangout video with Jonathan here: www.youtube.com/watch?v=1sROVZ83FNg
#rstats #databs
Posit Software Architect @jmcphers.bsky.social says, "there are certainly no plans to get rid of RStudio."
Watch the full #DSHangout video with Jonathan here: www.youtube.com/watch?v=1sROVZ83FNg
#rstats #databs
October 9, 2025 at 6:28 AM
Happy to hear this. Positron certainly has its merits, but I think RStudio is a much better choice for the quiet majority who use #Rstats for statistical analyses rather than software engineering.
This is a great update! I really like how colour palettes are now part of themes and the ink and paper feature in themes.

I am beyond excited to announce that ggplot2 4.0.0 has just landed on CRAN.
It's not every day we have a new major #ggplot2 release but it is a fitting 18 year birthday present for the package.
Get an overview of the release in this blog post and be on the lookout for more in-depth posts #rstats
It's not every day we have a new major #ggplot2 release but it is a fitting 18 year birthday present for the package.
Get an overview of the release in this blog post and be on the lookout for more in-depth posts #rstats

ggplot2 4.0.0
A new major version of ggplot2 has been released on CRAN. Find out what is new here.
www.tidyverse.org
September 11, 2025 at 11:50 AM
This is a great update! I really like how colour palettes are now part of themes and the ink and paper feature in themes.
Reposted by Måns Thulin

{tinytable} 0.13.0 for #RStats can now draw interactive tables with sorting, filtering & pages!
And the 📦 is still an ultra-simple, powerful, and 0-dep way to create beautiful tables in basically any format: tex, typ, docx, pdf, png, md, etc
Gallery & Docs: vincentarelbundock.github.io/tinytable/
And the 📦 is still an ultra-simple, powerful, and 0-dep way to create beautiful tables in basically any format: tex, typ, docx, pdf, png, md, etc
Gallery & Docs: vincentarelbundock.github.io/tinytable/
August 19, 2025 at 9:24 PM
{tinytable} 0.13.0 for #RStats can now draw interactive tables with sorting, filtering & pages!
And the 📦 is still an ultra-simple, powerful, and 0-dep way to create beautiful tables in basically any format: tex, typ, docx, pdf, png, md, etc
Gallery & Docs: vincentarelbundock.github.io/tinytable/
And the 📦 is still an ultra-simple, powerful, and 0-dep way to create beautiful tables in basically any format: tex, typ, docx, pdf, png, md, etc
Gallery & Docs: vincentarelbundock.github.io/tinytable/
Reposted by Måns Thulin

#rstats #statistics
I've released my new open source book, "Powered by Linear Algebra: the role of matrices and vector space in data science," at matloff.github.io/WackyLinearA....
Turns the classic LA course on its head! Still proves the theorems, but with a deep emphasis on applications.
I've released my new open source book, "Powered by Linear Algebra: the role of matrices and vector space in data science," at matloff.github.io/WackyLinearA....
Turns the classic LA course on its head! Still proves the theorems, but with a deep emphasis on applications.
matloff.github.io
August 15, 2025 at 4:53 PM
#rstats #statistics
I've released my new open source book, "Powered by Linear Algebra: the role of matrices and vector space in data science," at matloff.github.io/WackyLinearA....
Turns the classic LA course on its head! Still proves the theorems, but with a deep emphasis on applications.
I've released my new open source book, "Powered by Linear Algebra: the role of matrices and vector space in data science," at matloff.github.io/WackyLinearA....
Turns the classic LA course on its head! Still proves the theorems, but with a deep emphasis on applications.
Reposted by Måns Thulin

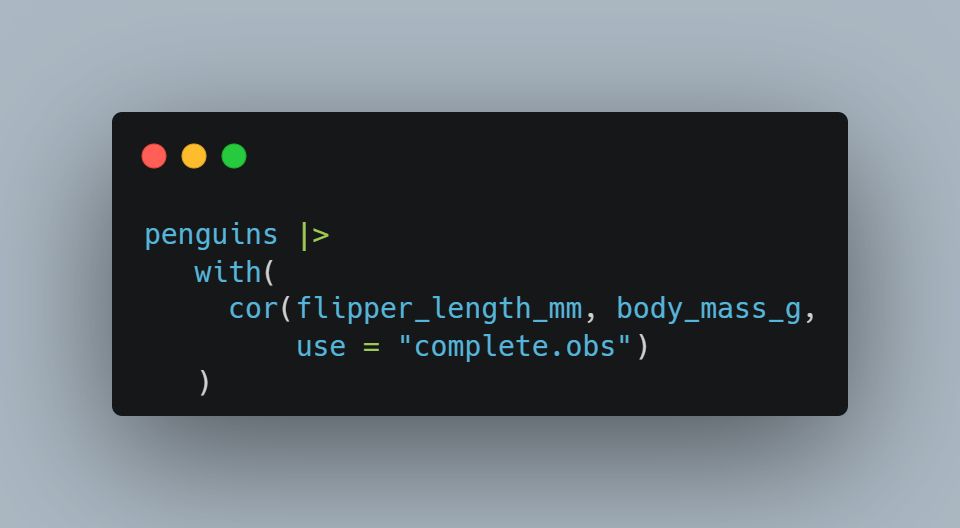
Wow ... I'd never come across this use of with(), which allows combining the pipe and computing a correlation coefficient. Thanks to @mansthulin.bsky.social for explaining this in his fantastic book www.modernstatisticswithr.com!
#Rstats #code #neverknew
#Rstats #code #neverknew
July 22, 2025 at 12:22 PM
Wow ... I'd never come across this use of with(), which allows combining the pipe and computing a correlation coefficient. Thanks to @mansthulin.bsky.social for explaining this in his fantastic book www.modernstatisticswithr.com!
#Rstats #code #neverknew
#Rstats #code #neverknew
I really enjoyed attending and speaking at R/Medicine this year! I learned a lot. Huge thanks to the organisers! My talk "Bootstrap inference made easy" is now available online: www.youtube.com/watch?v=EeAt...
#Rstats #Statsky
#Rstats #Statsky
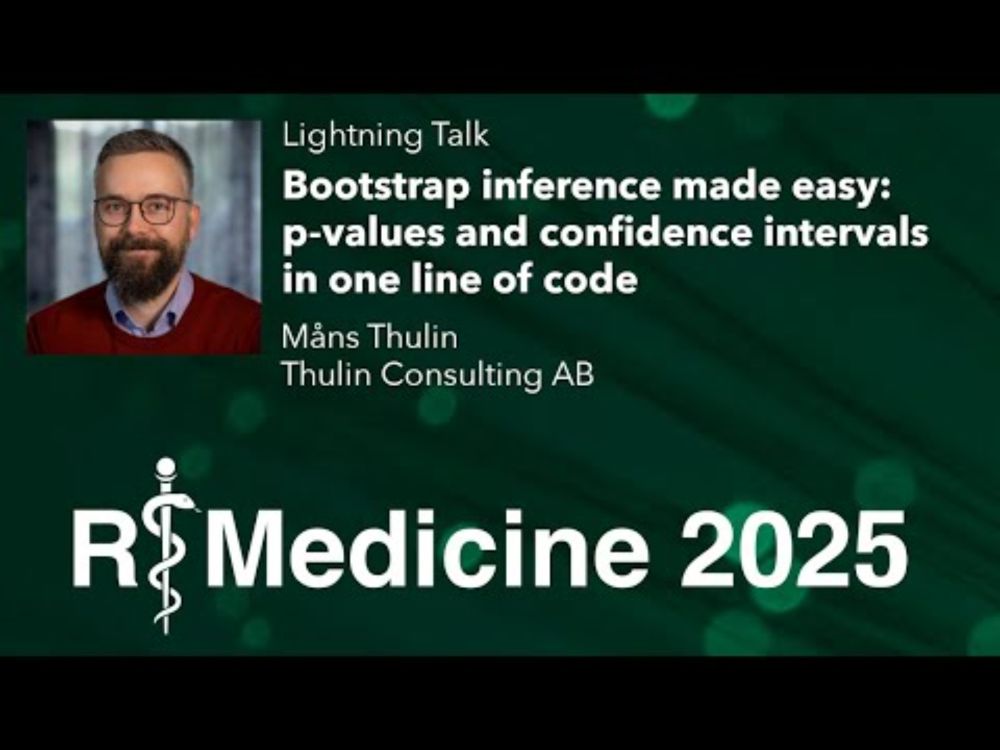
Bootstrap inference made easy: p-values and confidence intervals in one line of code
YouTube video by R Consortium
www.youtube.com
July 2, 2025 at 6:47 AM
I really enjoyed attending and speaking at R/Medicine this year! I learned a lot. Huge thanks to the organisers! My talk "Bootstrap inference made easy" is now available online: www.youtube.com/watch?v=EeAt...
#Rstats #Statsky
#Rstats #Statsky
Reposted by Måns Thulin

For the #rstats nerds: 405 is "Method not allowed". That is why R 4.0.5 was nicknamed "Shake and Throw", due to this piece of dubious pedagogy:
www.gocomics.com/peanuts/1978...
www.gocomics.com/peanuts/1978...
June 3, 2025 at 9:36 AM
For the #rstats nerds: 405 is "Method not allowed". That is why R 4.0.5 was nicknamed "Shake and Throw", due to this piece of dubious pedagogy:
www.gocomics.com/peanuts/1978...
www.gocomics.com/peanuts/1978...
Reposted by Måns Thulin


The most common question I get when teaching ggplot2: "Can we change the background colour?"
Yes, we can - and much more. Here's how to create your own ggplot2 themes:
🔗 mansthulin.se/posts/ggplot...
#Rstats #datasky
Yes, we can - and much more. Here's how to create your own ggplot2 themes:
🔗 mansthulin.se/posts/ggplot...
#Rstats #datasky
Creating a custom ggplot2 theme – Måns Thulin
mansthulin.se
May 21, 2025 at 12:06 PM
The most common question I get when teaching ggplot2: "Can we change the background colour?"
Yes, we can - and much more. Here's how to create your own ggplot2 themes:
🔗 mansthulin.se/posts/ggplot...
#Rstats #datasky
Yes, we can - and much more. Here's how to create your own ggplot2 themes:
🔗 mansthulin.se/posts/ggplot...
#Rstats #datasky
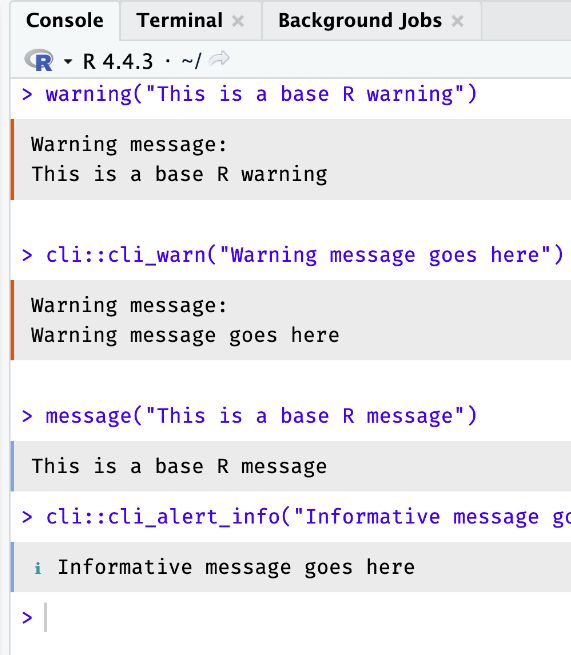
The new release of RStudio prints errors, warnings and messages in different colours. That's a great improvement! I teach introductory #Rstats a lot, and students *always* think messages are errors. Hopefully this will help.
May 9, 2025 at 6:53 AM
The new release of RStudio prints errors, warnings and messages in different colours. That's a great improvement! I teach introductory #Rstats a lot, and students *always* think messages are errors. Hopefully this will help.
Reposted by Måns Thulin

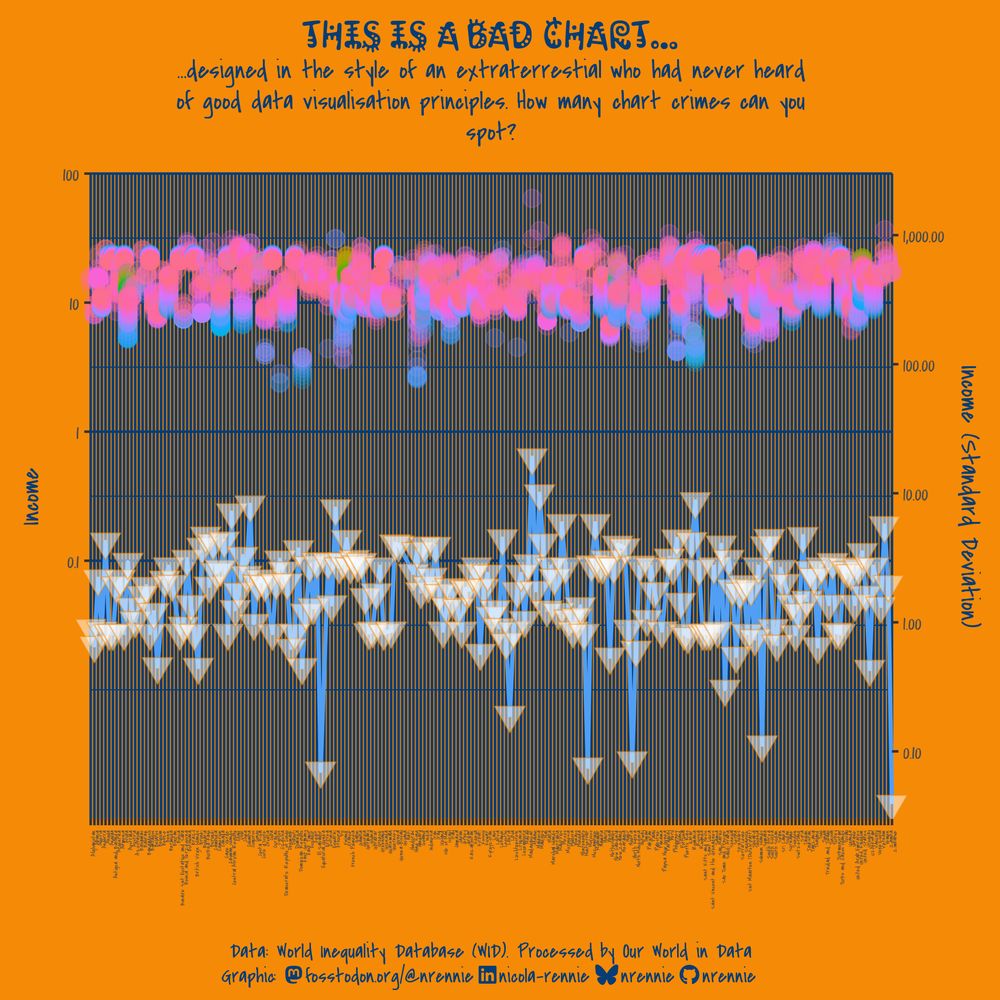
For the prompt of "Extraterrestrial" on Day29 of the #30DayChartChallenge, I decided to make a chart designed in the style of an extraterrestrial who has never heard of good data visualisation principles! 📊
How many chart crimes can you spot? 🕵️♂️
#DataViz #RStats #ggplot2 #Day29
How many chart crimes can you spot? 🕵️♂️
#DataViz #RStats #ggplot2 #Day29
April 29, 2025 at 8:05 AM
For the prompt of "Extraterrestrial" on Day29 of the #30DayChartChallenge, I decided to make a chart designed in the style of an extraterrestrial who has never heard of good data visualisation principles! 📊
How many chart crimes can you spot? 🕵️♂️
#DataViz #RStats #ggplot2 #Day29
How many chart crimes can you spot? 🕵️♂️
#DataViz #RStats #ggplot2 #Day29
I created the {boot.pval} #Rstats 📦 aiming to make it easier to run bootstrap tests in R. Here's an example showing how you can use it to implement a correlation test using the bootstrap:
mansthulin.se/posts/custom...
mansthulin.se/posts/custom...
Running bootstrap tests using {boot.pval} – Måns Thulin
mansthulin.se
April 16, 2025 at 1:49 PM
I created the {boot.pval} #Rstats 📦 aiming to make it easier to run bootstrap tests in R. Here's an example showing how you can use it to implement a correlation test using the bootstrap:
mansthulin.se/posts/custom...
mansthulin.se/posts/custom...
Reposted by Måns Thulin
📚😅🎉
Yay!! I just submitted the complete manuscript of my upcoming book to the publisher!
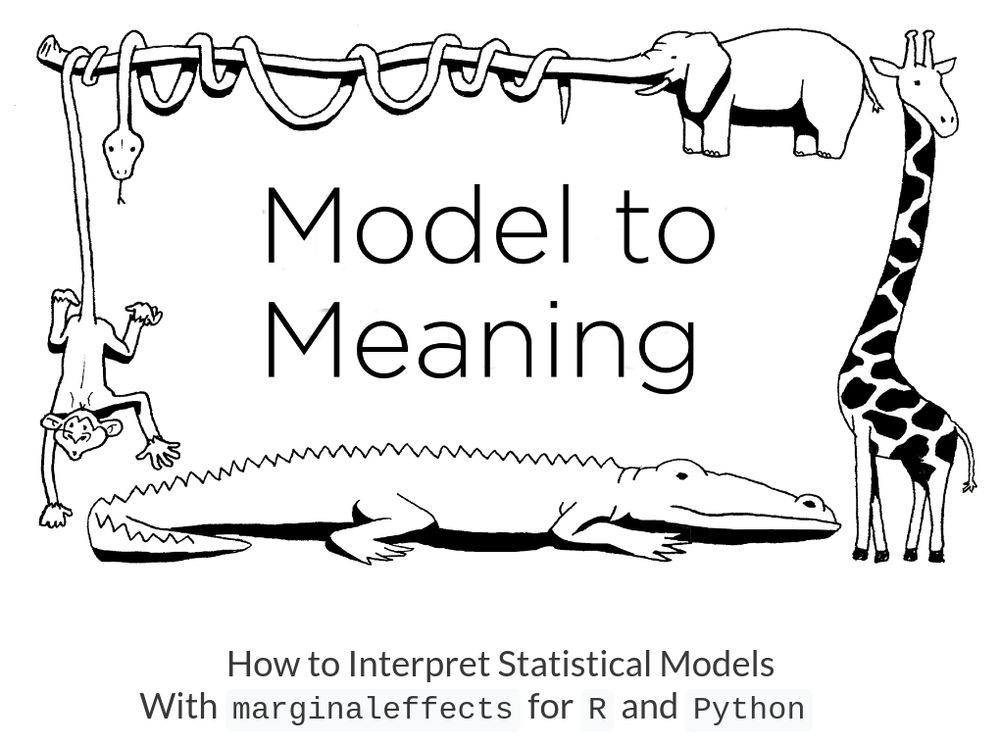
Learn to easily and clearly interpret (almost) any stats model w/ R or Python. Simple ideas, consistent workflow, powerful tools, detailed case studies.
Read it for free @ marginaleffects.com
#RStats #PyData
Yay!! I just submitted the complete manuscript of my upcoming book to the publisher!
Learn to easily and clearly interpret (almost) any stats model w/ R or Python. Simple ideas, consistent workflow, powerful tools, detailed case studies.
Read it for free @ marginaleffects.com
#RStats #PyData
April 10, 2025 at 7:06 PM
📚😅🎉
Yay!! I just submitted the complete manuscript of my upcoming book to the publisher!
Learn to easily and clearly interpret (almost) any stats model w/ R or Python. Simple ideas, consistent workflow, powerful tools, detailed case studies.
Read it for free @ marginaleffects.com
#RStats #PyData
Yay!! I just submitted the complete manuscript of my upcoming book to the publisher!
Learn to easily and clearly interpret (almost) any stats model w/ R or Python. Simple ideas, consistent workflow, powerful tools, detailed case studies.
Read it for free @ marginaleffects.com
#RStats #PyData
A bit of a treasure trove this!
#rstats Version 0.9-3 of the {HistData} 📦 is now on #CRAN, largely a maintenance release. Another near record time from submission to accept (28 min).
Already bumped the dev version, anticipating neat graphic examples from @drjohnrussell.com
friendly.github.io/HistData/
Already bumped the dev version, anticipating neat graphic examples from @drjohnrussell.com
friendly.github.io/HistData/
Data Sets from the History of Statistics and Data Visualization
The HistData package provides a collection of small data sets that are interesting and important in the history of statistics and data visualization. The goal of the package is to make these available...
friendly.github.io
April 9, 2025 at 5:18 PM
A bit of a treasure trove this!
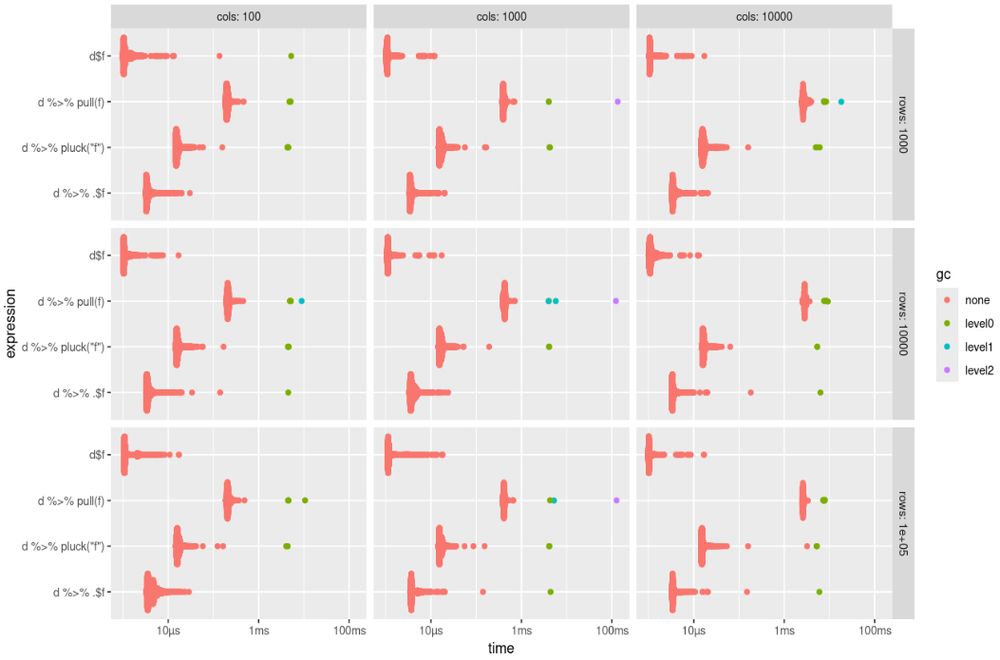
Base R can do what filter(), select(), and mutate() do — no tidyverse needed.
Check out some side-by-side examples in my latest blog post:
🧑💻 mansthulin.se/posts/baseti...
#Rstats
Check out some side-by-side examples in my latest blog post:
🧑💻 mansthulin.se/posts/baseti...
#Rstats
![airquality |>
transform(TempC = (Temp-32)/1.8,
Month = month.name[Month]) |>
aggregate(TempC ~ Month, mean)](https://cdn.bsky.app/img/feed_thumbnail/plain/did:plc:nwakte3xnyrtvrebiq6mad3z/bafkreig5vph4x2r6pdnkcqim34eh3r6nkwevmvg23syjtk6um2bjrm5udu@jpeg)
April 9, 2025 at 2:20 PM
Base R can do what filter(), select(), and mutate() do — no tidyverse needed.
Check out some side-by-side examples in my latest blog post:
🧑💻 mansthulin.se/posts/baseti...
#Rstats
Check out some side-by-side examples in my latest blog post:
🧑💻 mansthulin.se/posts/baseti...
#Rstats
Reposted by Måns Thulin

Somewhere in Berlin, fitting in with the atmosphere, there is now a little R hexsticker graffiti #rstats #DAGStat_2025


March 26, 2025 at 12:04 PM
Somewhere in Berlin, fitting in with the atmosphere, there is now a little R hexsticker graffiti #rstats #DAGStat_2025
Reposted by Måns Thulin

Who has an academic website they’re proud of?
I’m especially interested in websites by grad students, and in websites built with Quarto. I’ll be offering a local workshop on building a website with Quarto, and I’m keen to give my audience examples. #rstats
I’m especially interested in websites by grad students, and in websites built with Quarto. I’ll be offering a local workshop on building a website with Quarto, and I’m keen to give my audience examples. #rstats
March 19, 2025 at 2:27 PM
Who has an academic website they’re proud of?
I’m especially interested in websites by grad students, and in websites built with Quarto. I’ll be offering a local workshop on building a website with Quarto, and I’m keen to give my audience examples. #rstats
I’m especially interested in websites by grad students, and in websites built with Quarto. I’ll be offering a local workshop on building a website with Quarto, and I’m keen to give my audience examples. #rstats
This seems pretty useful! Any recommendations for LLMs than run locally that I can use when I try it out? (I have a GeForce RTX 4080 GPU with 16 GB RAM and 9728 CUDA cores) #Rstats

Introducing gander, the AI-powered coding assistant that can describe objects in your #RStats environment!
gander provides detailed data descriptions directly to LLMs for more accurate coding assistance.
Explore the motivation and see an example in @simonpcouch.com's post: posit.co/blog/introdu...
gander provides detailed data descriptions directly to LLMs for more accurate coding assistance.
Explore the motivation and see an example in @simonpcouch.com's post: posit.co/blog/introdu...

March 17, 2025 at 2:37 PM
This seems pretty useful! Any recommendations for LLMs than run locally that I can use when I try it out? (I have a GeForce RTX 4080 GPU with 16 GB RAM and 9728 CUDA cores) #Rstats
Interpreting residual plots can be tricky - how strong must patterns be to indicate model assumption violations? The latest #Rstats 📦 nullabor update makes this easier with lineup plots! 🔍
📈 Learn more: mansthulin.se/posts/nullab...
📈 Learn more: mansthulin.se/posts/nullab...

March 5, 2025 at 10:09 AM
Interpreting residual plots can be tricky - how strong must patterns be to indicate model assumption violations? The latest #Rstats 📦 nullabor update makes this easier with lineup plots! 🔍
📈 Learn more: mansthulin.se/posts/nullab...
📈 Learn more: mansthulin.se/posts/nullab...