Martin Stendel
@martinstendel.bsky.social
1.7K followers 720 following 210 posts
Senior Researcher, Danish Meteorological Institute 
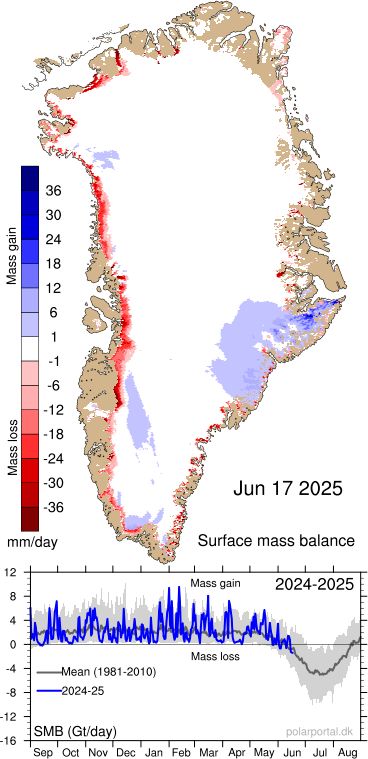
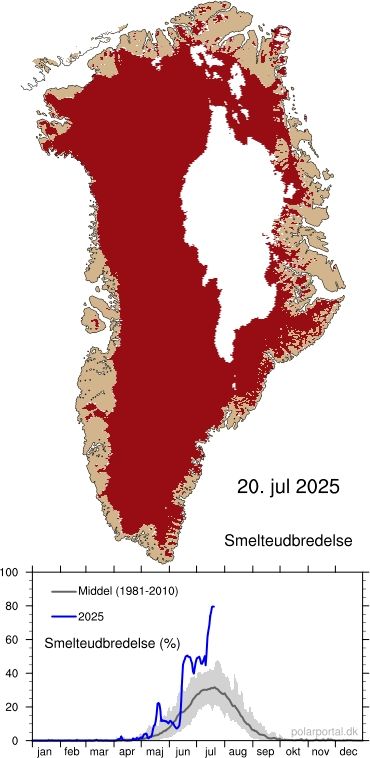
Coordinator of PolarPortal (lots of up-to-date Arctic data) and ROPEWALK (huge Danish logbook digitization project) Conveying science to the public. Born @317 ppm. Mastodon @[email protected]
Posts Media Videos Starter Packs
Pinned
martinstendel.bsky.social
Components of the total mass balance TMB, hydr. years 1987-2025:
SMB: surface mass balance (snowfall-runoff),
MMB: marine mass balance (calving of icebergs),
BMB: basal mass balance (friction).
2024/25: the 29th year in a row with negative TMB.
Update of Mankoff et al. (2021), tinyurl.com/295khdnk.
Components of the total mass balance over the Greenland Ice Sheet for the hydrological years 1987-2025. The hydrological year 2025 goes from 1 September 2024 to 31 August 2025, similar for other years.

Total mass balance TMB: red line, should be zero on average, but isn't. Greenland has lost ice for the last 29 years in a row. TMB is the sum of the following three components:

SMB: surface mass balance (snowfall minus runoff, blue line) - always positive, only possibility for the ice sheet to gain mass. Highly variable ("weather");

MMB: marine mass balance (calving of icebergs, melting of glacier tongues in contact with sea water, green line) - always negative, ice loss has slightly increased over time;

BMB: basal mass balance (frictional effects, ground heat flux, orange line) - small, but also always negative.

In 2024/25, the Greenland Ice Sheet has lost 105 Gt (=105 cubic kilometers) of ice.

Note that the SMB values differ from those published on the @polarportal, since the figure shown here is an average of three models.
Based on Mankoff et al. (2021, updated), https://doi.org/10.5194/essd-13-5001-2021.
martinstendel.bsky.social
151 years and almost 9 months of daily maximum temperatures in Copenhagen, 1874-2025!
Green line: daily average
Light blue/orange: 10 and 90 percentiles
Blue/red: absolute lowest and highest maximum
Purple: values for 2025.
Grey: all other years
Warm mid-September exceeding the old record from 1947.
Graphic showing daily values of maximum temperature in Copenhagen, 1874 to mid-September 2025. Lines in different colours:
Green line in the middle: daily average
Light blue/orange: 10 and 90 percentiles
Blue/red: absolute lowest and highest maximum
Purple: values for 2025.
Grey: all other years
Warm mid-September exceeding the old record from 1947.
Reposted by Martin Stendel
katmabu.bsky.social
Trump just designated “Antifa” as a terrorist organization, on par with ISIS and Al Qaeda. As a reminder, “antifa” is short for “antifascist”.

They will use this lie to surveil, imprison, and kill Americans on the left.

This may be our Reichstag Fire moment. Wake up.

www.cnn.com/2025/09/17/p...
Trump says he’s designating Antifa as a terrorist organization | CNN Politics
President Donald Trump said he is designating the far-left anti-fascism movement Antifa as a terrorist organization, announcing the move on his Truth Social platform in the early hours of Thursday mor...
www.cnn.com
martinstendel.bsky.social
Mondfinsternis - Lunar eclipse - Måneformørkelse
Total lunar eclipse on 7 September 2025 seen from Copenhagen. Total lunar eclipse on 7 September 2025 seen from Copenhagen. Total lunar eclipse on 7 September 2025 seen from Copenhagen.
martinstendel.bsky.social
Things were easier in 1954 when meteorologists still wore ties.
Cover painting for Collier's magazine, May 1954, entitled Weather made to order? 

In the foreground, a meteorologist with a white shirt, tie, and glasses moves a large lever on a control panel. Leaning back, he looks at the sky of the landscape behind him.  One half of the background shows a red and orange sky and a sunny green landscape.  The other half shows dark storm clouds. Snow is covering the ground and also falling, while a stroke of lightning hits the ground.
Reposted by Martin Stendel
polarportal.bsky.social
Accumulated surface mass balance (SMB) 1 Sep 2024 to 31 Aug 2025 was 403.8 Gt (=km³), close to the average 1980-2025. SMB is snowfall - runoff, i.e. always positive.
This is NOT the total mass balance TMB, which also includes iceberg calving and which shows ice loss for the 29th year in a row.
The accumulated surface mass balance (SMB) for the "SMB year" 1 September 2024 to 31 August 2025 ended at 403.8 Gt (=km³), which is a little above the average 1980-2025, mainly due to the rather cool summer.

There is mass gain over the interior of the ice sheet and mass loss along the coasts, in particular in southwestern Greenland.
martinstendel.bsky.social
Components of the total mass balance TMB, hydr. years 1987-2025:
SMB: surface mass balance (snowfall-runoff),
MMB: marine mass balance (calving of icebergs),
BMB: basal mass balance (friction).
2024/25: the 29th year in a row with negative TMB.
Update of Mankoff et al. (2021), tinyurl.com/295khdnk.
Components of the total mass balance over the Greenland Ice Sheet for the hydrological years 1987-2025. The hydrological year 2025 goes from 1 September 2024 to 31 August 2025, similar for other years.

Total mass balance TMB: red line, should be zero on average, but isn't. Greenland has lost ice for the last 29 years in a row. TMB is the sum of the following three components:

SMB: surface mass balance (snowfall minus runoff, blue line) - always positive, only possibility for the ice sheet to gain mass. Highly variable ("weather");

MMB: marine mass balance (calving of icebergs, melting of glacier tongues in contact with sea water, green line) - always negative, ice loss has slightly increased over time;

BMB: basal mass balance (frictional effects, ground heat flux, orange line) - small, but also always negative.

In 2024/25, the Greenland Ice Sheet has lost 105 Gt (=105 cubic kilometers) of ice.

Note that the SMB values differ from those published on the @polarportal, since the figure shown here is an average of three models.
Based on Mankoff et al. (2021, updated), https://doi.org/10.5194/essd-13-5001-2021.
martinstendel.bsky.social
As it is quite probable that at the end of the week it turns out that it is worth starting a war of aggression, I asked Gemini to give me a map of Europe showing Putin's next desires (i.e., all countries bordering either Russia or Belarus). I must say the result is pretty convincing.
Map of Europe according to Gemini with lots of mistakes. What should be Poland is labelled Latvia, what should be Romania is labelled Ukraine, what should be Iceland is labelled Norway etc. etc.
martinstendel.bsky.social
And even 81.2% yesterday.
martinstendel.bsky.social
Melting over 80.6% of the area of the Greenland Ice Sheet. This is the highest value in our data set, which starts in 1981.

@polarportal.bsky.social
Screenshot from polarportal.dk, a website that makes research on the Arctic research conducted by Danish institutions available to the public and researchers. The image shows Greenland in tan and the Greenland Ice Sheet in red and white. The red part indicates melting and covers all except about 20% in the northeast, which is roughly the area higher than 2500 m above Se level.

Below the map is a chart that compares 2025 melting to the 1981-2010 average. The average melting peaks in mid-July at about 35%. For the last few days, melting has occurred over roughly 80% of the area of Greenland, with a maximum melt area of 80.6% on 24 July 2025. This is the highest value in our dataset, which starts in 1981.
martinstendel.bsky.social
Extreme Greenland melting event right now: thawing over 80% of the surface. Seen before only once in the record melt summer 2012.

See more at @polarportal.bsky.social!
Reposted by Martin Stendel
polarportal.bsky.social
PLEASE NOTE: Data source for sea ice concentration and extent has changed.

Beginning 1 July 2025, the Japanese AMSR2 is replacing the US SSMIS instrument for our sea ice concentration and extent products.

SSMIS and AMSR2 differ by ±0.1 million km² or less with larger differences in summer.
Shown are a map and a graph for sea ice extent on 8 July 2025 in the Arctic.

The map shows the sea ice extent in the Northern Hemisphere. There is only ice in the inner Arctic. 

The graph shows the annual variation in the extent of the sea ice in the Northern Hemisphere. Here, the extent of the sea ice is defined by areas that have an ice concentration of at least 15%, i.e. 15% of the surface is covered by ice. The values for 2025 are very close to or below the minimum ice extent of the last 40 years.

As the access to the SSMIS data from the US Department of Defense satellites will stop on 31 July 2025, we have replaced it with the Japanese AMSR2 data, an example of which is shown here.
martinstendel.bsky.social
If there is one graph showing the effect of human activities on the atmosphere, it is the Keeling curve, which shows the concentration of CO₂ since 1958.

Mauna Loa Observatory captured the reality of climate change. The US plans to shut it down theconversation.com/mauna-loa-ob...
Mauna Loa Observatory captured the reality of climate change. The US plans to shut it down
Cutting data climate collection – as the Trump administration is now trying to do – is like breaking a thermometer to avoid knowing you’ve got a fever.
theconversation.com
martinstendel.bsky.social
Lennart Bengtsson, former director of the ECMWF and the Max Planck Institute for Meteorology, the father of reanalyses and the ECHAM climate model and my boss from 1994 to 1998, has turned 90.

mpimet.mpg.de/en/communica...
Lennart Bengtsson is celebrating his 90th birthday
The Max Planck Institute for Meteorology congratulates its former director, Lennart Bengtsson, on his special day.
mpimet.mpg.de
martinstendel.bsky.social
More people to die soon?
nhc-atlc.nws-bot.us
Atlantic Tropical Depression Chantal Advisory Number 9 issued at Sun, 06 Jul 2025 20:44:09 +0000
...CHANTAL MOVING ACROSS SOUTHEAST NORTH CAROLINA... ...FLASH FLOOD THREAT CONTINUES AS RAINBANDS MOVE ACROSS CENTRAL NORTH CAROLINA AND SOUTH-CENTRAL VIRGINIA...
Additional Details Here.

        ZCZC NFDTCPAT3 ALLTTAA00 KWNH DDHHMM BULLETINTropical Depression Chantal Advisory Number   9NWS Weather Prediction Center College Park MD   AL032025500 PM EDT Sun Jul 06 2025 ...CHANTAL MOVING ACROSS SOUTHEAST NORTH CAROLINA......FLASH FLOOD THREAT CONTINUES AS RAINBANDS MOVE ACROSS CENTRALNORTH CAROLINA AND SOUTH-CENTRAL VIRGINIA...  SUMMARY OF 500 PM EDT...2100 UTC...INFORMATION----------------------------------------------LOCATION...34.9N 79.0WABOUT 65 MI...105 KM SSW OF RALEIGH NORTH CAROLINAABOUT 85 MI...135 KM NW OF WILMINGTON NORTH CAROLINAMAXIMUM SUSTAINED WINDS...30 MPH...45 KM/HPRESENT MOVEMENT...NNE OR 20 DEGREES AT 10 MPH...17 KM/HMINIMUM CENTRAL PRESSURE...1007 MB...29.74 INCHES  WATCHES AND WARNINGS--------------------Flood watches are in effect for...* Central North Carolina* South-central Virginia  DISCUSSION AND OUTLOOK----------------------At 500 PM EDT (2100 UTC), the center of Tropical Depression Chantalwas located near latitude 34.9 North, longitude 79.0 West. Thedepression is moving toward the north-northeast near 10 mph (17km/h).  Chantal is expected to move at a faster forward speed as it turns more northeastward over the next 24 hours. Maximum sustained winds are near 30 mph (45 km/h) with higher gusts.Some weakening is expected overnight as it moves farther inland with some slight restrengthening possible as it nears the Virginia Capes on Monday. The estimated minimum central pressure is 1007 mb (29.74 inches).  HAZARDS AFFECTING LAND----------------------Key messages for Tropical Depression Chantal can be found in theTropical Cyclone Discussion under AWIPS header MIATCDAT3 and WMOheader WTNT43 KNHC. RAINFALL: Tropical Depression Chantal will continue to produce heavyrainfall across portions of central North Carolina and south-central Virginia into Monday.  Storm total rainfall of 2 to 4 inches, with local amounts up to 6 inches, is expected. An elevated risk for flash flooding will continue. For a complete depiction of forecast rainfall and flash floodingassociated with Tropical Depression Chantal, please see the NationalWeather Service Storm Total Rainfall Graphic, available athurricanes.gov/graphics_at3.shtml?rainqpfFor a list of rainfall observations (and wind reports) associated this storm, see the companion storm summary at WBCSCCNS4 with the WMO header ACUS44 KWBC or at the following link: www.wpc.ncep.noaa.gov/discussions/nfdscc4.htmlTORNADOES: An isolated tornado or two is possible today over partsof eastern North Carolina. SURF: Life-threatening surf and rip current conditions are expectedto continue at beaches along the U.S. east coast from northeasternFlorida to the Mid-Atlantic states during the next day or so. A depiction of rip current risk for the United States can be foundat: hurricanes.gov/graphics_at3.shtml?ripCurrents  NEXT ADVISORY-------------Next complete advisory at 1100 PM EDT. $$Forecaster Roth NNNN
      Tropical Depression Chantal 5-Day Uncertainty Track Image Tropical Depression Chantal 34-Knot Wind Speed Probabilities
martinstendel.bsky.social
This will cost the GOP the midterm election. If there is an election.
Cartoon: Trump on a throne on the back of the GOP elephant. A sign "Big beautiful bill" on the side of the elephant. The animal is trampling and sitting on Trump's voters, who can he identified by their Naga caps.
martinstendel.bsky.social
151½ years of daily maximum temperatures in Copenhagen, 1874-2025!
Green line in the middle: daily average
Light blue/orange: 10 and 90 percentiles
Blue/red: absolute lowest and highest maximum
Purple: values for 2025.
Grey: all other years
Note the "heat wave" 4 to 8 March, 10°C above the average!
Graphic showing daily values of maximum temperature in Copenhagen, 1874 to end of June 2025. Lines in different colours:
Green line in the middle: daily average
Light blue/orange: 10 and 90 percentiles
Blue/red: absolute lowest and highest maximum
Purple: values for 2025.
Grey: all other years
Remarkable 2025: "heat wave" 4 to 8 March, 10°C above the average.
martinstendel.bsky.social
Arguably. But let's see...
martinstendel.bsky.social
As a German I ask: what is the difference between this and a concentration camp?!
Detention camp Alligator Alcatraz in Florida. Bare ground, metal cages. Looks much like a concentration camp.
Reposted by Martin Stendel
polarportal.bsky.social
𝐈𝐌𝐏𝐎𝐑𝐓𝐀𝐍𝐓 𝐍𝐎𝐓𝐄: The access to SSMIS data  from the US DMSP satellites is coming to an end. 𝐓𝐡𝐞 𝐚𝐜𝐜𝐞𝐬𝐬 𝐭𝐨 𝐝𝐚𝐭𝐚 𝐰𝐢𝐥𝐥 𝐞𝐧𝐝 𝐚𝐥𝐫𝐞𝐚𝐝𝐲 𝟑𝟎 𝐉𝐮𝐧𝐞 𝟐𝟎𝟐𝟓. We are working on the matter and try to find a replacement.
Shown is one of the last images as an eye-catcher.
Reposted by Martin Stendel
zacklabe.com
So far this week:

❌ SSMIS data halted (think sea ice, snow, hurricane, ice sheet monitoring, etc)
❌ climate[dot]gov removed and redirected to...
❌ NOAA Climate homepage, which was modified (e.g., removed Climate Stripes and Climate Ready Nation references)
❌ false bills to ex-probationary employees
Reposted by Martin Stendel
alaskawx.bsky.social
This is very bad news. #Arctic #SeaIce @zacklabe.com @climatologist49.bsky.social
osi-saf.eumetsat.int
🚧Urgent notice to all SSMIS product users 🚧

We've just been informed that #SSMIS from the US #DMSP satellite will stop to be distributed on Monday 30/06/2025.
Consequently, we advise SSMIS only-based #SeaIce products users to urgently change.

More information:
osi-saf.eumetsat.int/community/st...
martinstendel.bsky.social
Ablation season in Greenland has begun, almost on date.
polarportal.bsky.social
The onset of the ablation season in Greenland is defined as the first of at least three days in a row with a surface mass balance below -1 km³ (= -1 gigaton). In 2025, this was on 15 June, 2 days later than the median 1981-2010.

Top: SMB, 17 June 2025
Bottom: sum of daily SMBs since 1 Sep 2024
A map and a line graph are shown with the ablation over Greenland in 2025. The onset of the ablation season in Greenland is defined as the first of at least three days in a row with a surface mass balance below -1 km³ (= -1 gigaton). In 2025, this was on 15 June, 2 days later than the median 1981-2010. Ice loss occurred mainly along the west coast.
martinstendel.bsky.social
Shouldn't have fired the NOAA people. But in everything, there's something good - he admitted having had a poor attendance.
Photo of Trump complaining about the weather forecast for his military parade.