Simon Lee
@simonleewx.com
4.4K followers
840 following
1.3K posts
Lecturer in Atmospheric Science, University of St Andrews. Co-Editor-in-Chief, Weather. Large-scale weather & climate variability, prediction & change. simonleewx.com
Posts
Media
Videos
Starter Packs
Simon Lee
@simonleewx.com
· 8h


Simon Lee
@simonleewx.com
· 19h
Simon Lee
@simonleewx.com
· 22h
Simon Lee
@simonleewx.com
· 1d

The gust that never was: a meteorological instrumentation mystery
Time series of 10-m wind speeds (maximum gust and minimum lull, units ms−1) at the University of Reading Atmospheric Observatory (51.441°N, 0.938°W, altitude 66m above MSL) for each minute 0000–2359 ...
rmets.onlinelibrary.wiley.com
Reposted by Simon Lee


Simon Lee
@simonleewx.com
· 3d
Simon Lee
@simonleewx.com
· 3d


Simon Lee
@simonleewx.com
· 3d
Simon Lee
@simonleewx.com
· 3d
Simon Lee
@simonleewx.com
· 3d
Reposted by Simon Lee
Simon Lee
@simonleewx.com
· 3d
Simon Lee
@simonleewx.com
· 3d
Simon Lee
@simonleewx.com
· 3d
Reposted by Simon Lee

Netweather
@netweather.tv
· 4d
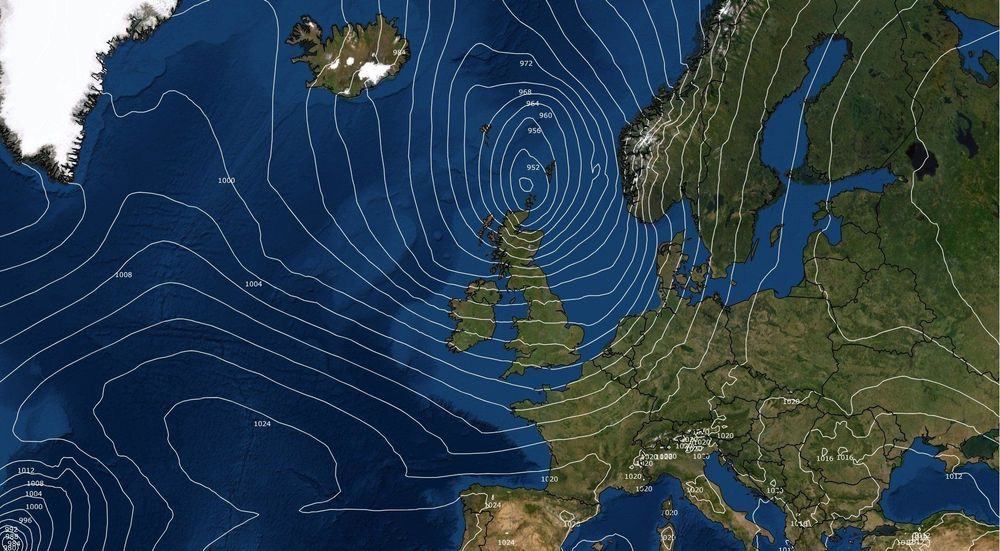
Storm Amy sets new October pressure record but settled conditions return next week
Storm Amy has brought severe disruption to Scotland with 96mph winds and widespread power outages, while setting a new October pressure record for the British Isles at 947.9hPa on Friday.<br/>
www.netweather.tv
Simon Lee
@simonleewx.com
· 4d
Simon Lee
@simonleewx.com
· 4d
Simon Lee
@simonleewx.com
· 4d
Simon Lee
@simonleewx.com
· 4d
Simon Lee
@simonleewx.com
· 4d
