Tiffany Wu
@tiffanyxwu.bsky.social
810 followers
510 following
15 posts
Edpsych PhD & Stats dual master's @UMich | IES Predoc Fellow | #rstats enthusiast | Former teacher | @NorthwesternU & @UChicago alumna | 🇹🇼🇺🇸
Website: https://tiffany-wu.github.io/
Posts
Media
Videos
Starter Packs
Pinned


Reposted by Tiffany Wu

Reposted by Tiffany Wu

Shaun M. Dougherty
@doughesm.bsky.social
· Aug 29
Doctor of Philosophy (Ph.D.) in Measurement, Evaluation, Statistics, and Assessment - Lynch School of Education and Human Development - Boston College
MESA has been training students to examine educational programs, design quantitative research studies, develop assessment instruments, and analyze educational data to help inform policy-making for ove...
www.bc.edu
Reposted by Tiffany Wu


Reposted by Tiffany Wu
Reposted by Tiffany Wu
Reposted by Tiffany Wu
Tiffany Wu
@tiffanyxwu.bsky.social
· May 28
Tiffany Wu
@tiffanyxwu.bsky.social
· May 28
Tiffany Wu
@tiffanyxwu.bsky.social
· May 28
Tiffany Wu
@tiffanyxwu.bsky.social
· May 28
Tiffany Wu
@tiffanyxwu.bsky.social
· May 28
Tiffany Wu
@tiffanyxwu.bsky.social
· May 28
Impacts of Oversubscribed Boston Pre-K Programs through Middle School
This study finds that Boston Public Schools’ (BPS) Pre-K program leads to stronger middle school outcomes than other preschool options. Although differences in outcomes between BPS Pre-K participants ...
edworkingpapers.com


Reposted by Tiffany Wu
Reposted by Tiffany Wu
Christina Weiland
@weilanch.bsky.social
· May 22

Reposted by Tiffany Wu
Reposted by Tiffany Wu

Reposted by Tiffany Wu
chloe gibbs
@chloergibbs.bsky.social
· Apr 18
Reposted by Tiffany Wu

Reposted by Tiffany Wu
Reposted by Tiffany Wu

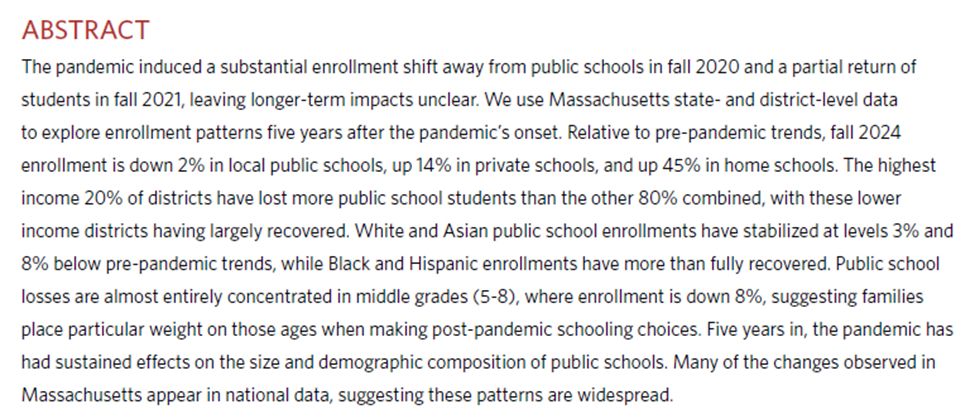
Prof Dynarski
@dynarski.bsky.social
· Mar 15

Reposted by Tiffany Wu
Reposted by Tiffany Wu
Reposted by Tiffany Wu