


Carlos Gómez Grajales
@cgrajales.bsky.social
Statistics, data and prog metal. That's it.
Reposted by Carlos Gómez Grajales

Geocomputation. Faster and better than GIS even when Python available.
October 30, 2025 at 1:23 AM
Geocomputation. Faster and better than GIS even when Python available.
Reposted by Carlos Gómez Grajales

The making of this week's #TidyTuesday chart recorded with {camcorder} in #RStats 📹
October 23, 2025 at 3:04 PM
The making of this week's #TidyTuesday chart recorded with {camcorder} in #RStats 📹
Reposted by Carlos Gómez Grajales

The Pink Book of #MarginalEffects (aka Model to Meaning) ships next week and I've got a backlog of Zoolander memes.
Hope you're hungry for some spam in your timeline.
#RStats #PyData
Hope you're hungry for some spam in your timeline.
#RStats #PyData

September 22, 2025 at 4:52 PM
The Pink Book of #MarginalEffects (aka Model to Meaning) ships next week and I've got a backlog of Zoolander memes.
Hope you're hungry for some spam in your timeline.
#RStats #PyData
Hope you're hungry for some spam in your timeline.
#RStats #PyData
Reposted by Carlos Gómez Grajales

The mlx_lm.server provides a rly nice OpenAI-compatible API server that serves up all the stored MLX models.
September 13, 2025 at 2:03 PM
The mlx_lm.server provides a rly nice OpenAI-compatible API server that serves up all the stored MLX models.
Reposted by Carlos Gómez Grajales

ggplot2 4.0.0 is out and the new `paper`, `ink`, `accent` theme variables look super cool! Just pick 2-3 colors 🎨 to make your plots look great! I'm excited to hook this up to brand.yml 😉

September 11, 2025 at 12:49 PM
ggplot2 4.0.0 is out and the new `paper`, `ink`, `accent` theme variables look super cool! Just pick 2-3 colors 🎨 to make your plots look great! I'm excited to hook this up to brand.yml 😉
Reposted by Carlos Gómez Grajales

Ever stared at a table of regression coefficients & wondered what you're doing with your life?
Very excited to share this gentle introduction to another way of making sense of statistical models (w @vincentab.bsky.social)
Preprint: doi.org/10.31234/osf...
Website: j-rohrer.github.io/marginal-psy...
Very excited to share this gentle introduction to another way of making sense of statistical models (w @vincentab.bsky.social)
Preprint: doi.org/10.31234/osf...
Website: j-rohrer.github.io/marginal-psy...


August 25, 2025 at 11:49 AM
Ever stared at a table of regression coefficients & wondered what you're doing with your life?
Very excited to share this gentle introduction to another way of making sense of statistical models (w @vincentab.bsky.social)
Preprint: doi.org/10.31234/osf...
Website: j-rohrer.github.io/marginal-psy...
Very excited to share this gentle introduction to another way of making sense of statistical models (w @vincentab.bsky.social)
Preprint: doi.org/10.31234/osf...
Website: j-rohrer.github.io/marginal-psy...
Reposted by Carlos Gómez Grajales

Erosion (R code)
Inspired by the ancient phreatic flows of Mammoth Cave National Park
#codeart #genartclub #genart
Inspired by the ancient phreatic flows of Mammoth Cave National Park
#codeart #genartclub #genart

August 20, 2025 at 3:58 AM
Erosion (R code)
Inspired by the ancient phreatic flows of Mammoth Cave National Park
#codeart #genartclub #genart
Inspired by the ancient phreatic flows of Mammoth Cave National Park
#codeart #genartclub #genart
Reposted by Carlos Gómez Grajales

Two weeks ago, I gave a workshop on high-performance mapping apps with #rstats and Shiny.
Shiny is *awesome* for web mapping apps... but can be slow when deployed if you aren't careful.
Here are three strategies that have saved my projects:
Shiny is *awesome* for web mapping apps... but can be slow when deployed if you aren't careful.
Here are three strategies that have saved my projects:

July 21, 2025 at 5:39 PM
Two weeks ago, I gave a workshop on high-performance mapping apps with #rstats and Shiny.
Shiny is *awesome* for web mapping apps... but can be slow when deployed if you aren't careful.
Here are three strategies that have saved my projects:
Shiny is *awesome* for web mapping apps... but can be slow when deployed if you aren't careful.
Here are three strategies that have saved my projects:
Reposted by Carlos Gómez Grajales
Good #DuckDB vibes in today's Drop given all the horrible that happened today and this week in general.
— DuckPlot is a useful ObsPlot+DuckDB homunculus
— The DuckDB Viz MCP == no SQL req'd interactive dataviz
— DuckDB-QuickJS extension adds serious JS powers to DuckDB queries
— DuckPlot is a useful ObsPlot+DuckDB homunculus
— The DuckDB Viz MCP == no SQL req'd interactive dataviz
— DuckDB-QuickJS extension adds serious JS powers to DuckDB queries

Drop #672 (2025-06-27): If It Walks Like A…
We have another 🦆-billed Drop today, featuring: DuckPlot — an open-source JavaScript library for generating charts from DuckDB with automatic SQL generation; The mcp-visualization-duckdb package, w…
dailydrop.hrbrmstr.dev
June 27, 2025 at 4:51 PM
Good #DuckDB vibes in today's Drop given all the horrible that happened today and this week in general.
— DuckPlot is a useful ObsPlot+DuckDB homunculus
— The DuckDB Viz MCP == no SQL req'd interactive dataviz
— DuckDB-QuickJS extension adds serious JS powers to DuckDB queries
— DuckPlot is a useful ObsPlot+DuckDB homunculus
— The DuckDB Viz MCP == no SQL req'd interactive dataviz
— DuckDB-QuickJS extension adds serious JS powers to DuckDB queries
Reposted by Carlos Gómez Grajales

Data science junkies, get ready! 🚀 "The Test Set" #podcast trailer is here for your viewing pleasure.
Tune in July 1st and every Tuesday after for new episodes with hosts @mchow.com, @hadley.nz, and @wesmckinney.com as they welcome thought leaders in #DataScience.
Subscribe now: pos.it/thetestset
Tune in July 1st and every Tuesday after for new episodes with hosts @mchow.com, @hadley.nz, and @wesmckinney.com as they welcome thought leaders in #DataScience.
Subscribe now: pos.it/thetestset
June 18, 2025 at 4:58 PM
Data science junkies, get ready! 🚀 "The Test Set" #podcast trailer is here for your viewing pleasure.
Tune in July 1st and every Tuesday after for new episodes with hosts @mchow.com, @hadley.nz, and @wesmckinney.com as they welcome thought leaders in #DataScience.
Subscribe now: pos.it/thetestset
Tune in July 1st and every Tuesday after for new episodes with hosts @mchow.com, @hadley.nz, and @wesmckinney.com as they welcome thought leaders in #DataScience.
Subscribe now: pos.it/thetestset
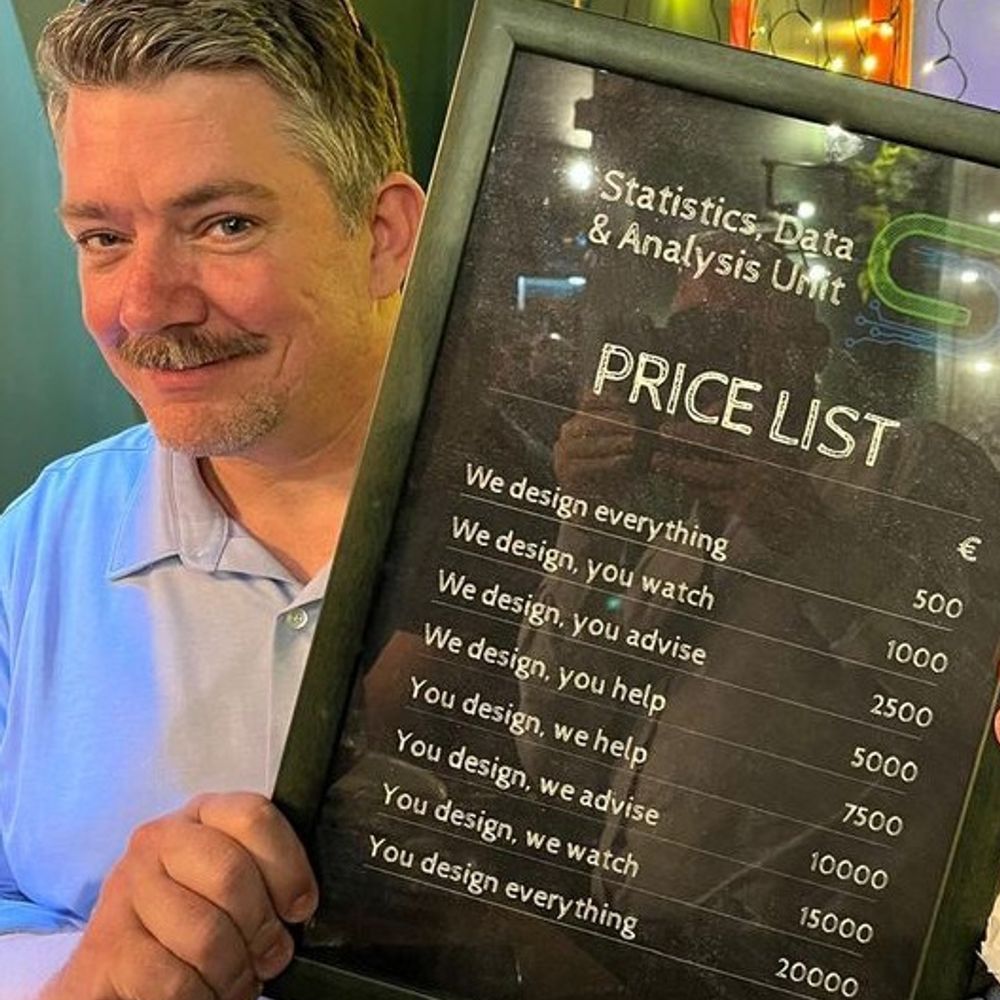
This is amazing on so many levels

May 29, 2025 at 3:12 AM
This is amazing on so many levels
Reposted by Carlos Gómez Grajales

If you load this page it contacts 82 IP addresses executing 256 separate HTTP transactions to download 18MB of data writing 64 cookies to your device to tell you “no”
May 24, 2025 at 10:37 AM
If you load this page it contacts 82 IP addresses executing 256 separate HTTP transactions to download 18MB of data writing 64 cookies to your device to tell you “no”
Reposted by Carlos Gómez Grajales
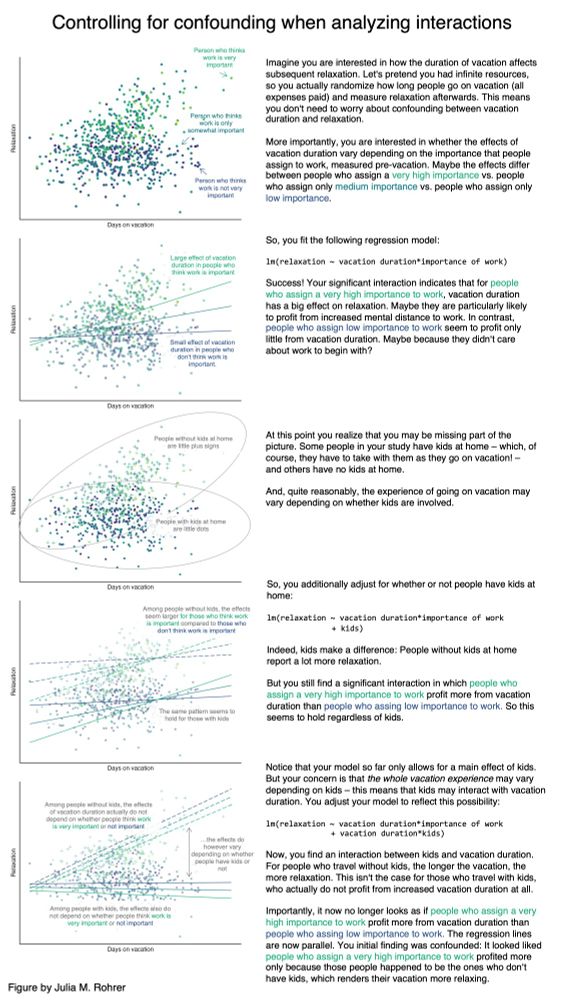
Thanks to everybody who chimed in!
I arrived at the conclusion that (1) there's a lot of interesting stuff about interactions and (2) the figure I was looking for does not exist.
So, I made it myself! Here's a simple illustration of how to control for confounding in interactions:>
I arrived at the conclusion that (1) there's a lot of interesting stuff about interactions and (2) the figure I was looking for does not exist.
So, I made it myself! Here's a simple illustration of how to control for confounding in interactions:>
May 11, 2025 at 5:34 AM
Thanks to everybody who chimed in!
I arrived at the conclusion that (1) there's a lot of interesting stuff about interactions and (2) the figure I was looking for does not exist.
So, I made it myself! Here's a simple illustration of how to control for confounding in interactions:>
I arrived at the conclusion that (1) there's a lot of interesting stuff about interactions and (2) the figure I was looking for does not exist.
So, I made it myself! Here's a simple illustration of how to control for confounding in interactions:>
Reposted by Carlos Gómez Grajales

Just made promptdown public. It's a plain-text interface for working with LLMs using literate programming.
See and edit the full prompt each turn.
No cramped input boxes, no hidden context, no append-only chat.
Still early alpha, feedback welcome!
github.com/t-kalinowski...
See and edit the full prompt each turn.
No cramped input boxes, no hidden context, no append-only chat.
Still early alpha, feedback welcome!
github.com/t-kalinowski...

May 8, 2025 at 3:36 PM
Just made promptdown public. It's a plain-text interface for working with LLMs using literate programming.
See and edit the full prompt each turn.
No cramped input boxes, no hidden context, no append-only chat.
Still early alpha, feedback welcome!
github.com/t-kalinowski...
See and edit the full prompt each turn.
No cramped input boxes, no hidden context, no append-only chat.
Still early alpha, feedback welcome!
github.com/t-kalinowski...
Reposted by Carlos Gómez Grajales

You call it an ifelse statement, I call it a lightweight, agentic decision module operating within a deterministic inference framework
April 16, 2025 at 3:27 AM
You call it an ifelse statement, I call it a lightweight, agentic decision module operating within a deterministic inference framework
👀 async

For the last couple of months I've been working on something and I'm excited to finally share an early preview:
Say hello to plumber2 🎉
plumber2 is a full rewrite of the plumber package for creating powerful webapis in #rstats. It takes everything we have learned from plumber and adds even more
Say hello to plumber2 🎉
plumber2 is a full rewrite of the plumber package for creating powerful webapis in #rstats. It takes everything we have learned from plumber and adds even more
What the Package Does (One Line, Title Case)
What the package does (one paragraph).
posit-dev.github.io
April 8, 2025 at 4:37 PM
👀 async
Reposted by Carlos Gómez Grajales

Thx to @ivelasq3.bsky.social for pointing me to this blog post of hers: ivelasq.rbind.io/blog/reticul...
I used it as an example to "port" the code to a rixpress pipeline which you can find here: github.com/b-rodrigues/...
end result is here: b-rodrigues.github.io/rixpress_dem...
#RStats #Python
I used it as an example to "port" the code to a rixpress pipeline which you can find here: github.com/b-rodrigues/...
end result is here: b-rodrigues.github.io/rixpress_dem...
#RStats #Python

Creating a dataset from an image using reticulate in R Markdown – %>% dreams
A cool paper used R and Python together — and so can you!
ivelasq.rbind.io
April 7, 2025 at 8:36 PM
Thx to @ivelasq3.bsky.social for pointing me to this blog post of hers: ivelasq.rbind.io/blog/reticul...
I used it as an example to "port" the code to a rixpress pipeline which you can find here: github.com/b-rodrigues/...
end result is here: b-rodrigues.github.io/rixpress_dem...
#RStats #Python
I used it as an example to "port" the code to a rixpress pipeline which you can find here: github.com/b-rodrigues/...
end result is here: b-rodrigues.github.io/rixpress_dem...
#RStats #Python
![R code in the image:
```rstats
xdf[,c("handle", "name", "description")] |>
unique() |>
within({
handle <- sub("^at://", "@", handle)
md <- sprintf(
fmt = "- (`%s`) %s%s%s",
handle,
name,
ifelse(is.na(description), "", ": "),
ifelse(is.na(description), "", description)
)
}) |>
sort_by(~md) |>
getElement("md") |>
writeLines()
```](https://cdn.bsky.app/img/feed_thumbnail/plain/did:plc:hgyzg2hn6zxpqokmp5c2xrdo/bafkreifr34id5gve6k4kkvhn7fkllae2xlkikcdh6gm4ts3qcsf4ax5w7a@jpeg)
Loved this summary. This is incredibly relevant for data practitioners even beyond survey sampling.

In which I have been asked the difference between strata and clusters in sampling
notstatschat.rbind.io/2025/04/04/s...
notstatschat.rbind.io/2025/04/04/s...
Strata and clusters - Biased and Inefficient
notstatschat.rbind.io
April 3, 2025 at 11:16 PM
Loved this summary. This is incredibly relevant for data practitioners even beyond survey sampling.
Reposted by Carlos Gómez Grajales
Yesterday,
All Trump’s tariffs seemed so far away,
Now it looks as though they’re here to stay,
Oh, trade was better yesterday.
Suddenly,
We’re importing less from overseas,
There’s a tariff hanging over me,
The economy acts so suddenly.
1/3
All Trump’s tariffs seemed so far away,
Now it looks as though they’re here to stay,
Oh, trade was better yesterday.
Suddenly,
We’re importing less from overseas,
There’s a tariff hanging over me,
The economy acts so suddenly.
1/3
April 3, 2025 at 5:29 PM
Yesterday,
All Trump’s tariffs seemed so far away,
Now it looks as though they’re here to stay,
Oh, trade was better yesterday.
Suddenly,
We’re importing less from overseas,
There’s a tariff hanging over me,
The economy acts so suddenly.
1/3
All Trump’s tariffs seemed so far away,
Now it looks as though they’re here to stay,
Oh, trade was better yesterday.
Suddenly,
We’re importing less from overseas,
There’s a tariff hanging over me,
The economy acts so suddenly.
1/3
Reposted by Carlos Gómez Grajales
A new release of the {mapgl} #rstats package - which brings Mapbox and MapLibre maps to R users - is now on CRAN!
There are lots of long-awaited features in this new release.
Learn more on my blog: walker-data.com/posts/mapgl-...
There are lots of long-awaited features in this new release.
Learn more on my blog: walker-data.com/posts/mapgl-...
March 20, 2025 at 2:15 PM
A new release of the {mapgl} #rstats package - which brings Mapbox and MapLibre maps to R users - is now on CRAN!
There are lots of long-awaited features in this new release.
Learn more on my blog: walker-data.com/posts/mapgl-...
There are lots of long-awaited features in this new release.
Learn more on my blog: walker-data.com/posts/mapgl-...
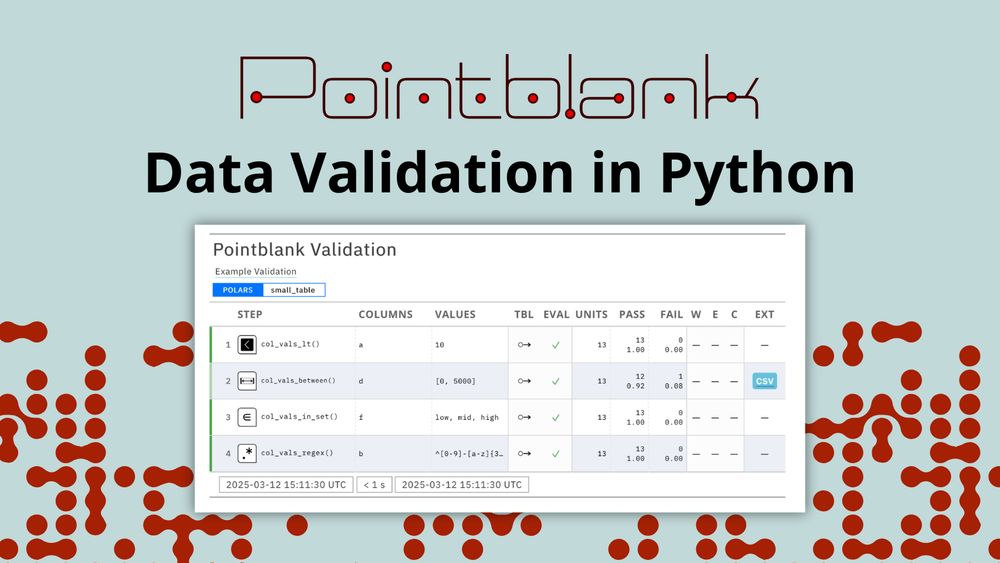
😍 Loved this in R but I needed it more in Python
We are thrilled to announce Pointblank for data validation in Python!
With Pointblank, you can check your data against expectations and constraints, get a beautiful report table, and examine detailed step results and metrics.
Learn more in the blog post: posit.co/blog/introdu...
#Python
With Pointblank, you can check your data against expectations and constraints, get a beautiful report table, and examine detailed step results and metrics.
Learn more in the blog post: posit.co/blog/introdu...
#Python
March 19, 2025 at 2:16 AM
😍 Loved this in R but I needed it more in Python
Been consulting many big companies, for many years, and something like this has happened at some point in every single one of them.

When my org stood up our first DS team we did an audit of all the Tableau dashboards scattered to the four winds and turned off nearly 2/3 of them because they had viewcounts in the single digits per week.
Those were fun days
Those were fun days
March 14, 2025 at 5:16 AM
Been consulting many big companies, for many years, and something like this has happened at some point in every single one of them.
Reposted by Carlos Gómez Grajales

We’ve had three years of github copilot and two of chatgpt, both promising magical productivity gains for software dev, and the only change noticed by regular users is that everything keeps getting shittier, but now with more useless chatbots
March 10, 2025 at 10:09 AM
We’ve had three years of github copilot and two of chatgpt, both promising magical productivity gains for software dev, and the only change noticed by regular users is that everything keeps getting shittier, but now with more useless chatbots
Fantastic resource for those of us (re) learning data viz and graphical story-telling

I made each of these graphs on ggplot2 and exported them to Adobe Illustrator to add further notes, titles, improve the legend, etc.
You can find scripts to recreate each of them here: github.com/owid/noteboo... The README file has a table to help quickly find each one.
You can find scripts to recreate each of them here: github.com/owid/noteboo... The README file has a table to help quickly find each one.

March 6, 2025 at 5:15 AM
Fantastic resource for those of us (re) learning data viz and graphical story-telling