


Leland McInnes
@lelandmcinnes.bsky.social
A Mathematician dabbling in Data Science, especially unsupervised learning and data exploration. UMAP, HDBSCAN, PyNNDescent, DataMapPlot. (He/Him)
Reposted by Leland McInnes

Fast-umap crates.io/crates/fast-... umap for machine learning.

crates.io: Rust Package Registry
crates.io
November 22, 2025 at 4:45 PM
Fast-umap crates.io/crates/fast-... umap for machine learning.
Reposted by Leland McInnes

Space DJ turns genre embeddings into a playable galaxy—pilot a ship, the music follows. 🚀
Key stats
768→128 PCA compression; 3D UMAP projection; three.js rendering; autopilot drift; high‑dim neighbors surfacing hidden similarities.
Key stats
768→128 PCA compression; 3D UMAP projection; three.js rendering; autopilot drift; high‑dim neighbors surfacing hidden similarities.
November 11, 2025 at 3:03 PM
Space DJ turns genre embeddings into a playable galaxy—pilot a ship, the music follows. 🚀
Key stats
768→128 PCA compression; 3D UMAP projection; three.js rendering; autopilot drift; high‑dim neighbors surfacing hidden similarities.
Key stats
768→128 PCA compression; 3D UMAP projection; three.js rendering; autopilot drift; high‑dim neighbors surfacing hidden similarities.
Reposted by Leland McInnes

via the magic of laion_clap embeddings and umap, my live coding thingy has a sample browser at last!
October 31, 2025 at 6:27 PM
via the magic of laion_clap embeddings and umap, my live coding thingy has a sample browser at last!
Reposted by Leland McInnes

I made this annotated scatter plot of 1 million FineWeb-Edu documents for @sashamtl.bsky.social's new TED talk.

October 31, 2025 at 2:52 PM
I made this annotated scatter plot of 1 million FineWeb-Edu documents for @sashamtl.bsky.social's new TED talk.
Reposted by Leland McInnes
Also really love how organic the plot looks with "inferno" (left) and "viridis" (right).

October 27, 2025 at 10:42 AM
Also really love how organic the plot looks with "inferno" (left) and "viridis" (right).
Reposted by Leland McInnes
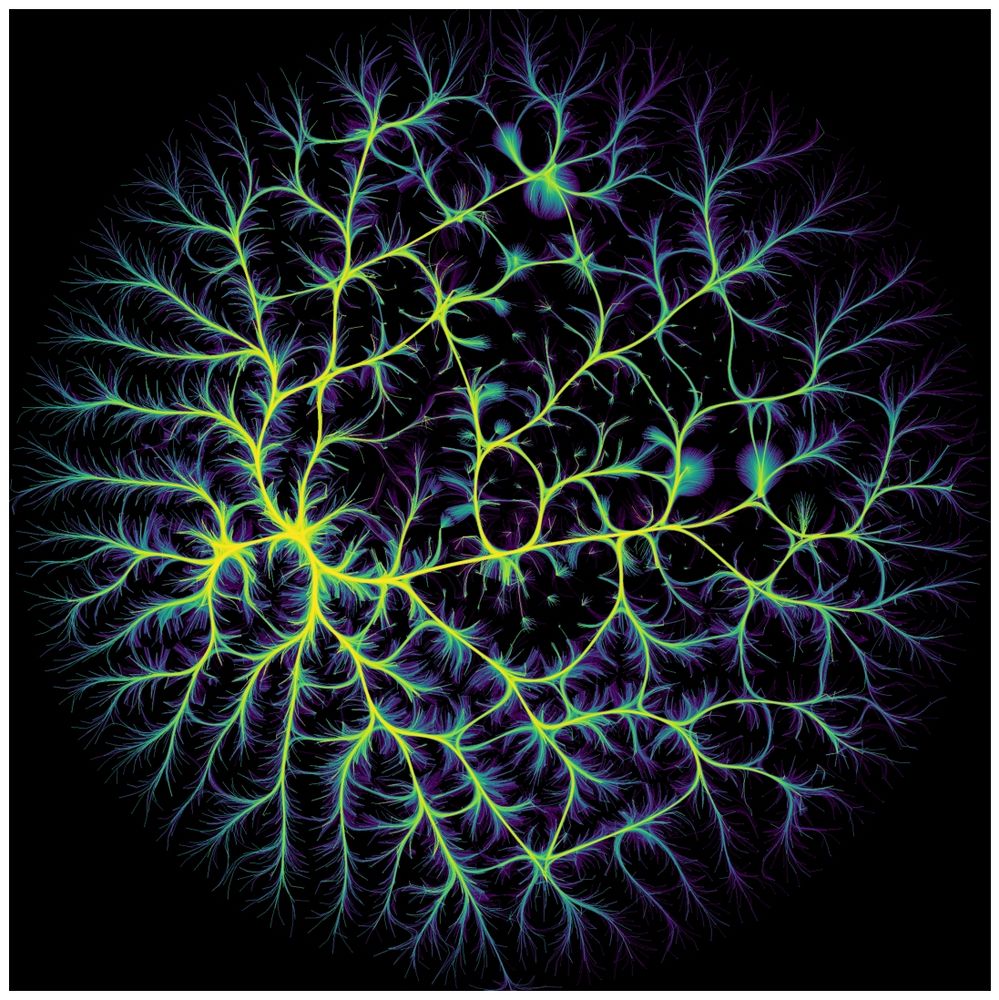
Map of the internet: 1.3M nodes (BGP)

October 26, 2025 at 1:39 PM
Map of the internet: 1.3M nodes (BGP)
The video of my talk at SciPy on DataMapPlot is up at last. If you make t-SNE or UMAP plots the talk provides some guidance on how to make plots most effective, and introduces a library to help make that easier.
www.youtube.com/watch?v=-iBh...
www.youtube.com/watch?v=-iBh...

Leland McInnes - DataMapPlot: Rich Tools for UMAP | SciPy 2025
YouTube video by SciPy
www.youtube.com
October 17, 2025 at 1:56 PM
The video of my talk at SciPy on DataMapPlot is up at last. If you make t-SNE or UMAP plots the talk provides some guidance on how to make plots most effective, and introduces a library to help make that easier.
www.youtube.com/watch?v=-iBh...
www.youtube.com/watch?v=-iBh...
Reposted by Leland McInnes
Despite the gutting of the National Center for Educational Statistics, the dept of Ed *did* manage to release 2024 college major counts in the usual format, so I can run it through the same code I do every year. First off, the change since peak of the largest fields -- another year of drops.

September 28, 2025 at 2:20 AM
Despite the gutting of the National Center for Educational Statistics, the dept of Ed *did* manage to release 2024 college major counts in the usual format, so I can run it through the same code I do every year. First off, the change since peak of the largest fields -- another year of drops.
Reposted by Leland McInnes

I'm very much a learner, but you're maybe asking if aspects of matrix factorisation approaches to dimensionality reduction apply here. But LocalMAP is a KNN approach, with a matrix factorisation initialisation. h/t @lelandmcinnes.bsky.social for his attempts to describe these youtu.be/9iol3Lk6kyU

A Bluffer's Guide to Dimension Reduction - Leland McInnes
YouTube video by PyData
youtu.be
September 26, 2025 at 2:42 PM
I'm very much a learner, but you're maybe asking if aspects of matrix factorisation approaches to dimensionality reduction apply here. But LocalMAP is a KNN approach, with a matrix factorisation initialisation. h/t @lelandmcinnes.bsky.social for his attempts to describe these youtu.be/9iol3Lk6kyU
Reposted by Leland McInnes

📢 Save the date!
Join us for the next @ellis.eu x UniReps Speaker Series!
📅 27th August – 16:00 CEST
📍https://ethz.zoom.us/j/66426188160
🎙️ Speakers: Keynote by @lelandmcinnes.bsky.social & Flash Talk by Yu (Demi) Qin
🔔 Stay updated by joining our Google group: groups.google.com/u/2/g/ellis-...
Join us for the next @ellis.eu x UniReps Speaker Series!
📅 27th August – 16:00 CEST
📍https://ethz.zoom.us/j/66426188160
🎙️ Speakers: Keynote by @lelandmcinnes.bsky.social & Flash Talk by Yu (Demi) Qin
🔔 Stay updated by joining our Google group: groups.google.com/u/2/g/ellis-...

August 14, 2025 at 7:58 AM
📢 Save the date!
Join us for the next @ellis.eu x UniReps Speaker Series!
📅 27th August – 16:00 CEST
📍https://ethz.zoom.us/j/66426188160
🎙️ Speakers: Keynote by @lelandmcinnes.bsky.social & Flash Talk by Yu (Demi) Qin
🔔 Stay updated by joining our Google group: groups.google.com/u/2/g/ellis-...
Join us for the next @ellis.eu x UniReps Speaker Series!
📅 27th August – 16:00 CEST
📍https://ethz.zoom.us/j/66426188160
🎙️ Speakers: Keynote by @lelandmcinnes.bsky.social & Flash Talk by Yu (Demi) Qin
🔔 Stay updated by joining our Google group: groups.google.com/u/2/g/ellis-...
Reposted by Leland McInnes

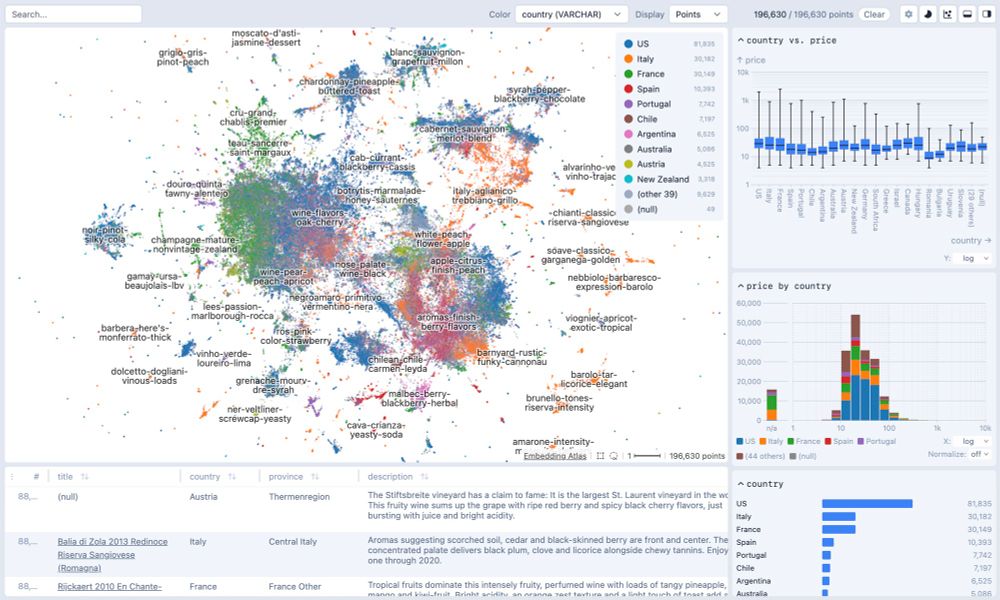
🚀 We've just open-sourced Embedding Atlas – a tool for exploring large embedding spaces through rich, interactive visualizations 📊.
August 1, 2025 at 8:24 AM
🚀 We've just open-sourced Embedding Atlas – a tool for exploring large embedding spaces through rich, interactive visualizations 📊.
Reposted by Leland McInnes

Meteoroid stream identification with HDBSCAN unsupervised clustering algorithm. Eloy Peña-Asensio et. al. https://arxiv.org/abs/2507.01501


July 3, 2025 at 7:46 AM
Meteoroid stream identification with HDBSCAN unsupervised clustering algorithm. Eloy Peña-Asensio et. al. https://arxiv.org/abs/2507.01501
Reposted by Leland McInnes

Ever wanted to pan through the latent🌌 space of TikTok videos? Made using the amazing toponymy and datamapplot from @lelandmcinnes.bsky.social
and data from mine and @jurgenpfeffer.bsky.social
's first complete TikTok slice. link below
and data from mine and @jurgenpfeffer.bsky.social
's first complete TikTok slice. link below
July 11, 2025 at 4:45 PM
Ever wanted to pan through the latent🌌 space of TikTok videos? Made using the amazing toponymy and datamapplot from @lelandmcinnes.bsky.social
and data from mine and @jurgenpfeffer.bsky.social
's first complete TikTok slice. link below
and data from mine and @jurgenpfeffer.bsky.social
's first complete TikTok slice. link below
Reposted by Leland McInnes

🎤 Speaker Spotlight: Leland McInnes
Join Leland at #SciPy2025 for his talk "DataMapPlot: Rich Tools for UMAP Visualizations." 📊
Discover powerful new ways to explore high-dimensional data!
🔗 scipy2025.scipy.org
Join Leland at #SciPy2025 for his talk "DataMapPlot: Rich Tools for UMAP Visualizations." 📊
Discover powerful new ways to explore high-dimensional data!
🔗 scipy2025.scipy.org

July 5, 2025 at 7:46 PM
🎤 Speaker Spotlight: Leland McInnes
Join Leland at #SciPy2025 for his talk "DataMapPlot: Rich Tools for UMAP Visualizations." 📊
Discover powerful new ways to explore high-dimensional data!
🔗 scipy2025.scipy.org
Join Leland at #SciPy2025 for his talk "DataMapPlot: Rich Tools for UMAP Visualizations." 📊
Discover powerful new ways to explore high-dimensional data!
🔗 scipy2025.scipy.org
Reposted by Leland McInnes
Explore Wikipedia through a data map. Pages are grouped by semantic similarity, for topic clusters.
Hover to see details, zoom to explore more fine-grained topics, click to go to a page. Search by page
name to find interesting starting points for exploration.
lmcinnes.github.io/datamapplot_...
Hover to see details, zoom to explore more fine-grained topics, click to go to a page. Search by page
name to find interesting starting points for exploration.
lmcinnes.github.io/datamapplot_...
June 22, 2025 at 3:36 PM
Explore Wikipedia through a data map. Pages are grouped by semantic similarity, for topic clusters.
Hover to see details, zoom to explore more fine-grained topics, click to go to a page. Search by page
name to find interesting starting points for exploration.
lmcinnes.github.io/datamapplot_...
Hover to see details, zoom to explore more fine-grained topics, click to go to a page. Search by page
name to find interesting starting points for exploration.
lmcinnes.github.io/datamapplot_...
I'll be giving a talk about DataMapPlot for visualizing data maps at Scipy this year. I would love to meet potential users and chat about where to go next.
cfp.scipy.org/scipy2025/ta...
cfp.scipy.org/scipy2025/ta...

June 23, 2025 at 11:41 PM
I'll be giving a talk about DataMapPlot for visualizing data maps at Scipy this year. I would love to meet potential users and chat about where to go next.
cfp.scipy.org/scipy2025/ta...
cfp.scipy.org/scipy2025/ta...
Reposted by Leland McInnes
I also updated the ArXiv data map example to make use of new features in datamapplot.
lmcinnes.github.io/datamapplot_...
You can tweak parameters and build your own version:
gist.github.com/lmcinnes/e11...
lmcinnes.github.io/datamapplot_...
You can tweak parameters and build your own version:
gist.github.com/lmcinnes/e11...
June 22, 2025 at 9:59 PM
I also updated the ArXiv data map example to make use of new features in datamapplot.
lmcinnes.github.io/datamapplot_...
You can tweak parameters and build your own version:
gist.github.com/lmcinnes/e11...
lmcinnes.github.io/datamapplot_...
You can tweak parameters and build your own version:
gist.github.com/lmcinnes/e11...
Reposted by Leland McInnes

OMG I am so glad someone finally did this.
Thank you 🙏 @lelandmcinnes.bsky.social
This will now consume hours and hours of my time.
lmcinnes.github.io/datamapplot_...
Thank you 🙏 @lelandmcinnes.bsky.social
This will now consume hours and hours of my time.
lmcinnes.github.io/datamapplot_...

June 23, 2025 at 12:12 PM
OMG I am so glad someone finally did this.
Thank you 🙏 @lelandmcinnes.bsky.social
This will now consume hours and hours of my time.
lmcinnes.github.io/datamapplot_...
Thank you 🙏 @lelandmcinnes.bsky.social
This will now consume hours and hours of my time.
lmcinnes.github.io/datamapplot_...
I also updated the ArXiv data map example to make use of new features in datamapplot.
lmcinnes.github.io/datamapplot_...
You can tweak parameters and build your own version:
gist.github.com/lmcinnes/e11...
lmcinnes.github.io/datamapplot_...
You can tweak parameters and build your own version:
gist.github.com/lmcinnes/e11...
June 22, 2025 at 9:59 PM
I also updated the ArXiv data map example to make use of new features in datamapplot.
lmcinnes.github.io/datamapplot_...
You can tweak parameters and build your own version:
gist.github.com/lmcinnes/e11...
lmcinnes.github.io/datamapplot_...
You can tweak parameters and build your own version:
gist.github.com/lmcinnes/e11...
Reposted by Leland McInnes

Great idea. Did no one think of this before?
Explore Wikipedia through a data map. Pages are grouped by semantic similarity, for topic clusters.
Hover to see details, zoom to explore more fine-grained topics, click to go to a page. Search by page
name to find interesting starting points for exploration.
lmcinnes.github.io/datamapplot_...
Hover to see details, zoom to explore more fine-grained topics, click to go to a page. Search by page
name to find interesting starting points for exploration.
lmcinnes.github.io/datamapplot_...
June 22, 2025 at 7:48 PM
Great idea. Did no one think of this before?
Explore Wikipedia through a data map. Pages are grouped by semantic similarity, for topic clusters.
Hover to see details, zoom to explore more fine-grained topics, click to go to a page. Search by page
name to find interesting starting points for exploration.
lmcinnes.github.io/datamapplot_...
Hover to see details, zoom to explore more fine-grained topics, click to go to a page. Search by page
name to find interesting starting points for exploration.
lmcinnes.github.io/datamapplot_...
June 22, 2025 at 3:36 PM
Explore Wikipedia through a data map. Pages are grouped by semantic similarity, for topic clusters.
Hover to see details, zoom to explore more fine-grained topics, click to go to a page. Search by page
name to find interesting starting points for exploration.
lmcinnes.github.io/datamapplot_...
Hover to see details, zoom to explore more fine-grained topics, click to go to a page. Search by page
name to find interesting starting points for exploration.
lmcinnes.github.io/datamapplot_...
Reposted by Leland McInnes
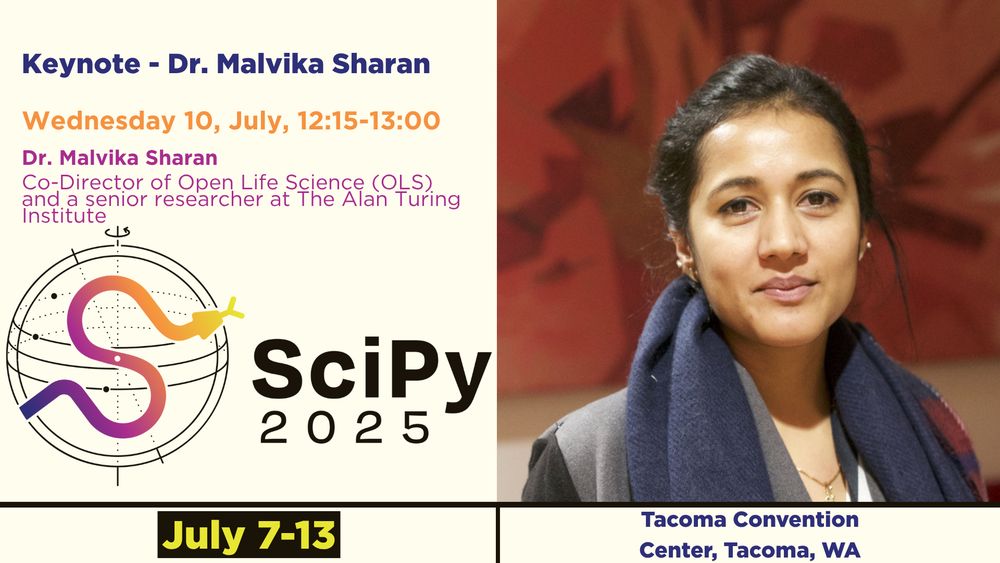
🔥 Meet our Keynote Speakers for #SciPy2025!
Dr Malvika Sharan, co-Director of Open Life Science (OLS) and a senior researcher at The Alan Turing Institute will be sharing with us her expertise at our favorite conference.
You can't miss her ➡️ hubs.la/Q03sdlsb0
Dr Malvika Sharan, co-Director of Open Life Science (OLS) and a senior researcher at The Alan Turing Institute will be sharing with us her expertise at our favorite conference.
You can't miss her ➡️ hubs.la/Q03sdlsb0
June 19, 2025 at 12:38 PM
🔥 Meet our Keynote Speakers for #SciPy2025!
Dr Malvika Sharan, co-Director of Open Life Science (OLS) and a senior researcher at The Alan Turing Institute will be sharing with us her expertise at our favorite conference.
You can't miss her ➡️ hubs.la/Q03sdlsb0
Dr Malvika Sharan, co-Director of Open Life Science (OLS) and a senior researcher at The Alan Turing Institute will be sharing with us her expertise at our favorite conference.
You can't miss her ➡️ hubs.la/Q03sdlsb0
Reposted by Leland McInnes
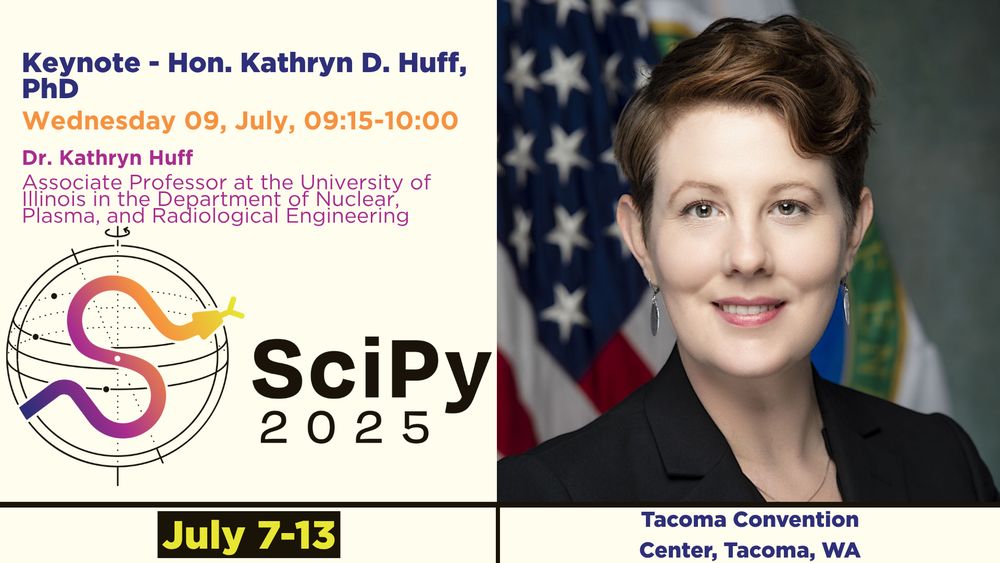
🔥 Meet our Keynote Speakers for #SciPy2025!
Hon. Dr. Kathryn D. Huff 🇺🇸, nuclear engineer, policy leader, and former Assistant Secretary for the Office of Nuclear Energy will be joining us in Tacoma! 🙌
Don't miss her talk, grab your ticket now: hubs.la/Q03sdlsb0
Hon. Dr. Kathryn D. Huff 🇺🇸, nuclear engineer, policy leader, and former Assistant Secretary for the Office of Nuclear Energy will be joining us in Tacoma! 🙌
Don't miss her talk, grab your ticket now: hubs.la/Q03sdlsb0
June 19, 2025 at 1:49 AM
🔥 Meet our Keynote Speakers for #SciPy2025!
Hon. Dr. Kathryn D. Huff 🇺🇸, nuclear engineer, policy leader, and former Assistant Secretary for the Office of Nuclear Energy will be joining us in Tacoma! 🙌
Don't miss her talk, grab your ticket now: hubs.la/Q03sdlsb0
Hon. Dr. Kathryn D. Huff 🇺🇸, nuclear engineer, policy leader, and former Assistant Secretary for the Office of Nuclear Energy will be joining us in Tacoma! 🙌
Don't miss her talk, grab your ticket now: hubs.la/Q03sdlsb0
Reposted by Leland McInnes

Nature Reviews Methods Primers: Uniform manifold approximation and projection (UMAP) www.nature.com/articles/s43... 🧬🖥️🧪 read free: rdcu.be/d0YZT


May 21, 2025 at 3:31 PM
Nature Reviews Methods Primers: Uniform manifold approximation and projection (UMAP) www.nature.com/articles/s43... 🧬🖥️🧪 read free: rdcu.be/d0YZT
Reposted by Leland McInnes
Our latest paper is out: peerj.com/articles/cs-.... We added functionality to the #HDBSCAN clustering algorithm to also detect branches hdbscan.readthedocs.io/en/latest/ho... #eda #datavis #clustering
FLASC: a flare-sensitive clustering algorithm
Exploratory data analysis workflows often use clustering algorithms to find groups of similar data points. The shape of these clusters can provide meaningful information about the data. For example, a...
peerj.com
April 18, 2025 at 9:59 AM
Our latest paper is out: peerj.com/articles/cs-.... We added functionality to the #HDBSCAN clustering algorithm to also detect branches hdbscan.readthedocs.io/en/latest/ho... #eda #datavis #clustering