


Tyler Morgan-Wall
@tylermw.com
R, data science, dataviz, maps, experimental design, raytracing. Developer of rayshader, rayrender, and the rayverse | PhD in Physics from Johns Hopkins | Penn
Pinned
Tyler Morgan-Wall
@tylermw.com
· Nov 8
Hi all! A (re)-introduction: I'm Tyler, developer of #rayshader and the #rayverse, a collection of R packages for 3D #dataviz and #mapping.
Here's one of my greatest hits (now that Bluesky supports videos!): The Earth's submarine fiber optic cable network, visualized in #RStats with #rayrender.
Here's one of my greatest hits (now that Bluesky supports videos!): The Earth's submarine fiber optic cable network, visualized in #RStats with #rayrender.
Reposted by Tyler Morgan-Wall
Slow clap everybody: I rendered the 3D route animation with 16 instead of 32 samples per image in order to get it done in an afternoon rather than overnight. #rayshader #rstats
January 11, 2026 at 1:19 AM
Slow clap everybody: I rendered the 3D route animation with 16 instead of 32 samples per image in order to get it done in an afternoon rather than overnight. #rayshader #rstats
Reposted by Tyler Morgan-Wall


January 10, 2026 at 6:08 AM
Reposted by Tyler Morgan-Wall
Trying something different with Mount Snow in neon.
Am of two minds about the light reflections...maybe microfacet is better.
#rayshader adventures, an #rstats tale
Am of two minds about the light reflections...maybe microfacet is better.
#rayshader adventures, an #rstats tale

January 9, 2026 at 4:34 PM
Trying something different with Mount Snow in neon.
Am of two minds about the light reflections...maybe microfacet is better.
#rayshader adventures, an #rstats tale
Am of two minds about the light reflections...maybe microfacet is better.
#rayshader adventures, an #rstats tale
Reposted by Tyler Morgan-Wall
This was supposed to be a draft render. Just a quick `render_highquality()` with no additional arguments. Is it me or does it already look pretty good?
#rayshader adventures, an #rstats tale
#rayshader adventures, an #rstats tale

January 9, 2026 at 3:52 AM
This was supposed to be a draft render. Just a quick `render_highquality()` with no additional arguments. Is it me or does it already look pretty good?
#rayshader adventures, an #rstats tale
#rayshader adventures, an #rstats tale
Reposted by Tyler Morgan-Wall

January 8, 2026 at 2:37 PM
Reposted by Tyler Morgan-Wall
Found the code to do this strange attractor while looking for something else. Thought I'd see how fast I can render 360 frames of this with denoising.
What used to take hours now takes slightly more than 60 minutes.
#rayrender adventures, an #rstats tale
What used to take hours now takes slightly more than 60 minutes.
#rayrender adventures, an #rstats tale
January 8, 2026 at 1:46 PM
Found the code to do this strange attractor while looking for something else. Thought I'd see how fast I can render 360 frames of this with denoising.
What used to take hours now takes slightly more than 60 minutes.
#rayrender adventures, an #rstats tale
What used to take hours now takes slightly more than 60 minutes.
#rayrender adventures, an #rstats tale
Reposted by Tyler Morgan-Wall

Zootopia 2 took hundreds of artists, TDs, and engineers to make; I was lucky enough to be a small part of it all! Here are some of my personal thoughts/notes from working on Zootopia 2, along with some pretty pictures.
blog.yiningkarlli.com/2025/12/zoot...
blog.yiningkarlli.com/2025/12/zoot...

January 7, 2026 at 9:24 AM
Zootopia 2 took hundreds of artists, TDs, and engineers to make; I was lucky enough to be a small part of it all! Here are some of my personal thoughts/notes from working on Zootopia 2, along with some pretty pictures.
blog.yiningkarlli.com/2025/12/zoot...
blog.yiningkarlli.com/2025/12/zoot...
Reposted by Tyler Morgan-Wall
Smart choice not updating. I enjoyed reading this post; really got at the UX issues with Tahoe.
What's worse: Tahoe broke XQuartz and I have to rgl_widget() as a workaround. 😠
What's worse: Tahoe broke XQuartz and I have to rgl_widget() as a workaround. 😠
January 7, 2026 at 2:44 PM
Smart choice not updating. I enjoyed reading this post; really got at the UX issues with Tahoe.
What's worse: Tahoe broke XQuartz and I have to rgl_widget() as a workaround. 😠
What's worse: Tahoe broke XQuartz and I have to rgl_widget() as a workaround. 😠
Reposted by Tyler Morgan-Wall
Power lines of Germany revisited, this time showing both OSM and derived power lines.
Should have done this from the start but was afraid it'd take too long to render this many lines. Guess not! :)
#rayshader adventures, an #rstats tale
Should have done this from the start but was afraid it'd take too long to render this many lines. Guess not! :)
#rayshader adventures, an #rstats tale

January 7, 2026 at 12:41 PM
Power lines of Germany revisited, this time showing both OSM and derived power lines.
Should have done this from the start but was afraid it'd take too long to render this many lines. Guess not! :)
#rayshader adventures, an #rstats tale
Should have done this from the start but was afraid it'd take too long to render this many lines. Guess not! :)
#rayshader adventures, an #rstats tale
Reposted by Tyler Morgan-Wall

Mappy New Year! 🗺️ Kicking off 2026 with this triple polar vortex animation
#Geospatial #GIS #GISChat #DataVisualization #Automation
#Geospatial #GIS #GISChat #DataVisualization #Automation
January 6, 2026 at 4:30 PM
Mappy New Year! 🗺️ Kicking off 2026 with this triple polar vortex animation
#Geospatial #GIS #GISChat #DataVisualization #Automation
#Geospatial #GIS #GISChat #DataVisualization #Automation
Reposted by Tyler Morgan-Wall
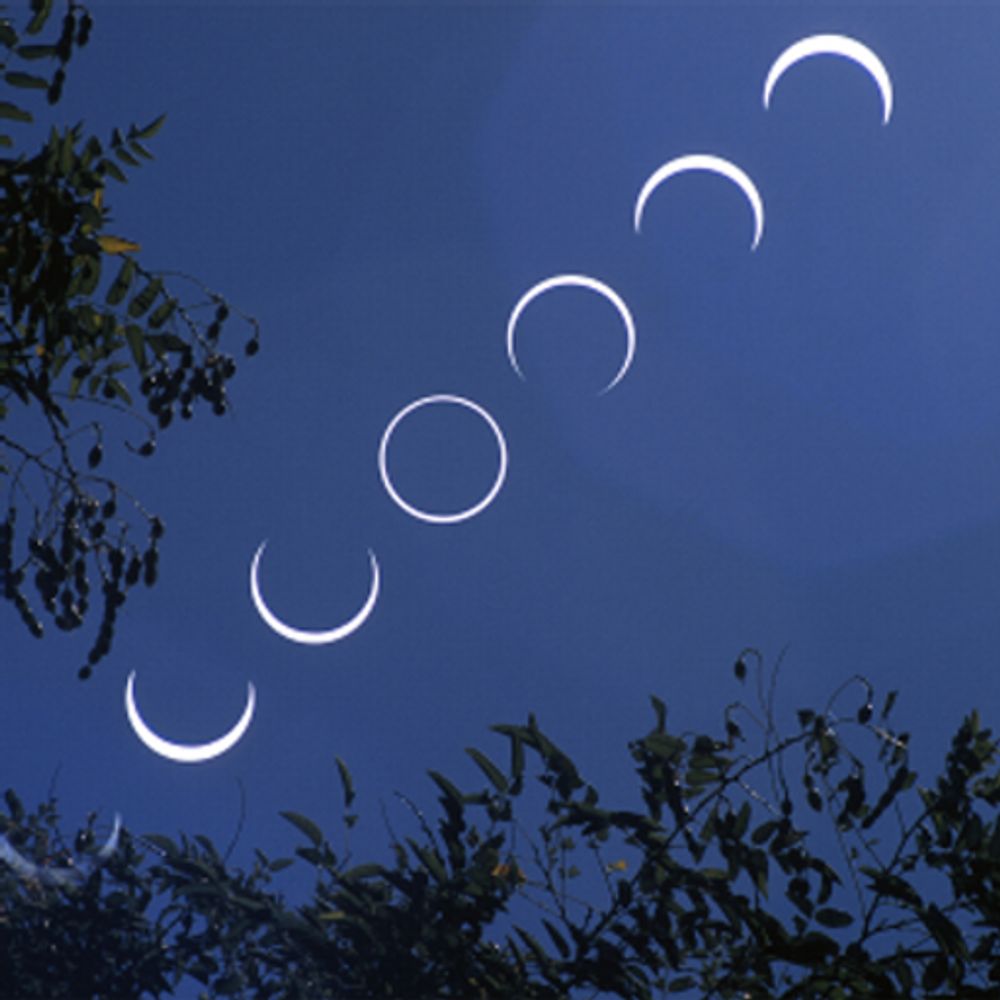
Happy new year! My all sky camera imaged the sky every 15 seconds and this picture shows what happened in the sky in 2025. It shows the length of the night and day with the hourglass shape, the monthly lunar cycle with the diagonal bands, the elevation of the Sun at local noon, and lots of clouds.

January 1, 2026 at 8:54 PM
Happy new year! My all sky camera imaged the sky every 15 seconds and this picture shows what happened in the sky in 2025. It shows the length of the night and day with the hourglass shape, the monthly lunar cycle with the diagonal bands, the elevation of the Sun at local noon, and lots of clouds.
Reposted by Tyler Morgan-Wall

January 6, 2026 at 1:40 PM
Reposted by Tyler Morgan-Wall

Vegetarian Greek food restaurant called Don't Meat Your Gyros
January 5, 2026 at 2:54 PM
Vegetarian Greek food restaurant called Don't Meat Your Gyros
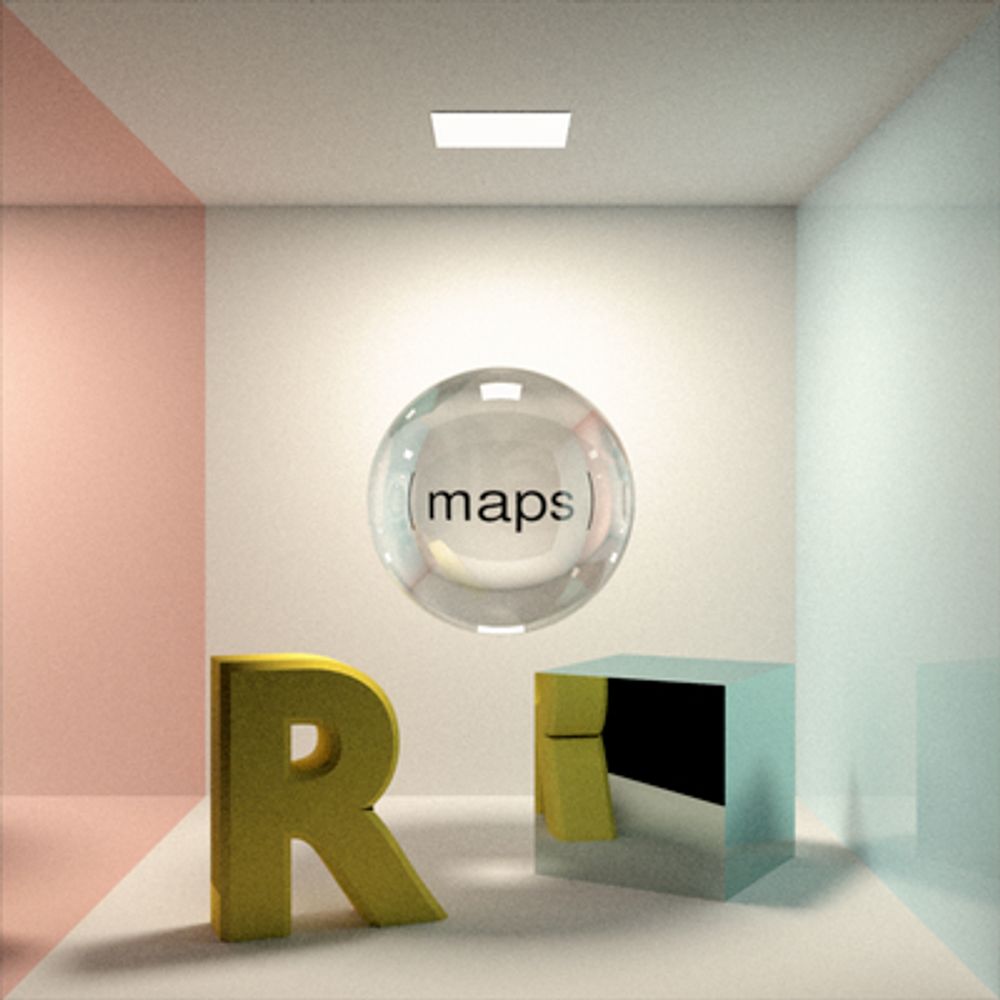
This blog post on the proliferation of icons in macOS Tahoe makes the decision clear: I'm never updating to this cluttered mess. Where did your aesthetic taste go, Apple? Yuck. 🤮
Left: Macintosh Human Interface Guidelines
Right: macOS Tahoe
Read the post:
tonsky.me/blog/tahoe-i...
Left: Macintosh Human Interface Guidelines
Right: macOS Tahoe
Read the post:
tonsky.me/blog/tahoe-i...


January 5, 2026 at 2:18 PM
This blog post on the proliferation of icons in macOS Tahoe makes the decision clear: I'm never updating to this cluttered mess. Where did your aesthetic taste go, Apple? Yuck. 🤮
Left: Macintosh Human Interface Guidelines
Right: macOS Tahoe
Read the post:
tonsky.me/blog/tahoe-i...
Left: Macintosh Human Interface Guidelines
Right: macOS Tahoe
Read the post:
tonsky.me/blog/tahoe-i...
Reposted by Tyler Morgan-Wall

Introducing gdalcli by Andrew Brown -- an R frontend to GDAL’s unified CLI (≥3.11) 🌐
Compose and execute GDAL workflows with pipe-friendly functions.
Learn more: github.com/brownag/gdal...
#RStats #GDAL #Geospatial #OpenSource #RSpatial
Compose and execute GDAL workflows with pipe-friendly functions.
Learn more: github.com/brownag/gdal...
#RStats #GDAL #Geospatial #OpenSource #RSpatial

GitHub - brownag/gdalcli: An R Frontend for the GDAL CLI
An R Frontend for the GDAL CLI. Contribute to brownag/gdalcli development by creating an account on GitHub.
github.com
January 4, 2026 at 3:01 PM
Introducing gdalcli by Andrew Brown -- an R frontend to GDAL’s unified CLI (≥3.11) 🌐
Compose and execute GDAL workflows with pipe-friendly functions.
Learn more: github.com/brownag/gdal...
#RStats #GDAL #Geospatial #OpenSource #RSpatial
Compose and execute GDAL workflows with pipe-friendly functions.
Learn more: github.com/brownag/gdal...
#RStats #GDAL #Geospatial #OpenSource #RSpatial


Reposted by Tyler Morgan-Wall

heads up that bluesky doesnt show posts from other languages by default on your timeline, and its cutting you off from a lot of the community
go to bsky.app/settings/lan... and deselect any language from this setting, or else you might not see any of the new japanese users at all!
go to bsky.app/settings/lan... and deselect any language from this setting, or else you might not see any of the new japanese users at all!

December 24, 2025 at 10:01 PM
heads up that bluesky doesnt show posts from other languages by default on your timeline, and its cutting you off from a lot of the community
go to bsky.app/settings/lan... and deselect any language from this setting, or else you might not see any of the new japanese users at all!
go to bsky.app/settings/lan... and deselect any language from this setting, or else you might not see any of the new japanese users at all!
Reposted by Tyler Morgan-Wall
made a map of Beirut yesterday
testing out a textured-greyscale style this time
#maps #beirut #rayshader #qgis #gimp
testing out a textured-greyscale style this time
#maps #beirut #rayshader #qgis #gimp

December 22, 2025 at 1:52 PM
made a map of Beirut yesterday
testing out a textured-greyscale style this time
#maps #beirut #rayshader #qgis #gimp
testing out a textured-greyscale style this time
#maps #beirut #rayshader #qgis #gimp
Reposted by Tyler Morgan-Wall

December 22, 2025 at 11:49 PM
Reposted by Tyler Morgan-Wall
iterating on a map of Cuba via rayshader and gimp
testing out some different coastline/hierarchy effects this time
#cuba #rayshader #gimp #maps
testing out some different coastline/hierarchy effects this time
#cuba #rayshader #gimp #maps

December 21, 2025 at 7:06 PM
iterating on a map of Cuba via rayshader and gimp
testing out some different coastline/hierarchy effects this time
#cuba #rayshader #gimp #maps
testing out some different coastline/hierarchy effects this time
#cuba #rayshader #gimp #maps
Reposted by Tyler Morgan-Wall

December 22, 2025 at 12:07 AM
Reposted by Tyler Morgan-Wall

If this same thing is ever an issue for someone on a Mac just shake the cursor real fast and it'll magnify it so you can find it. I use this constantly bc I have two monitors and also way too much on them.
For the past few years, I have occasionally have had trouble finding the mouse pointer on my monitor. I just chalked it up to getting older ("I guess it's all downhill from here!"). But recently, I found a feature in Windows that draws a circle around the mouse when you hit CTRL...
December 21, 2025 at 1:50 AM
If this same thing is ever an issue for someone on a Mac just shake the cursor real fast and it'll magnify it so you can find it. I use this constantly bc I have two monitors and also way too much on them.
For the past few years, I have occasionally have had trouble finding the mouse pointer on my monitor. I just chalked it up to getting older ("I guess it's all downhill from here!"). But recently, I found a feature in Windows that draws a circle around the mouse when you hit CTRL...
December 21, 2025 at 1:47 AM
For the past few years, I have occasionally have had trouble finding the mouse pointer on my monitor. I just chalked it up to getting older ("I guess it's all downhill from here!"). But recently, I found a feature in Windows that draws a circle around the mouse when you hit CTRL...
Reposted by Tyler Morgan-Wall

December 18, 2025 at 8:16 PM