


Antonio Antoine
@aasmith.bsky.social
This simple label took me over day to make. I am still learning expression builder in #QGIS. I needed the highest value for each feature from over one hundred attribute columns AND the name of the field name. The worst part is I don't know if I will use this info. lol

![Screenshot of QGIS showing the expression to find the highest value from a range of fields. The code reads as:
concat( "PARKNAME", '/',map_akeys(attributes())[array_find(map_avals(attributes()), array_max(array_slice(map_avals(attributes()), 10, 148)))], '/' , array_max(array_slice(map_avals(attributes()), 10, 148)))](https://cdn.bsky.app/img/feed_thumbnail/plain/did:plc:vxgrriczkvh2dojfuogcju2n/bafkreibba47gbphqr5oufxcsf7mw23rpzgdgnx2oowf3g5pvyeh5ue2ueu@jpeg)
January 15, 2026 at 8:54 PM
This simple label took me over day to make. I am still learning expression builder in #QGIS. I needed the highest value for each feature from over one hundred attribute columns AND the name of the field name. The worst part is I don't know if I will use this info. lol
Reposted by Antonio Antoine

couple interesting maps of climate change vulnerability across Canada by Isabeaux Graham on our team
check out more here: schoolofcities.utoronto.ca/layers-of-cl...
#maps #gis #canada #climateChange
check out more here: schoolofcities.utoronto.ca/layers-of-cl...
#maps #gis #canada #climateChange


January 14, 2026 at 9:23 PM
couple interesting maps of climate change vulnerability across Canada by Isabeaux Graham on our team
check out more here: schoolofcities.utoronto.ca/layers-of-cl...
#maps #gis #canada #climateChange
check out more here: schoolofcities.utoronto.ca/layers-of-cl...
#maps #gis #canada #climateChange
This is a very cool idea.

January 15, 2026 at 4:42 AM
This is a very cool idea.
Reposted by Antonio Antoine

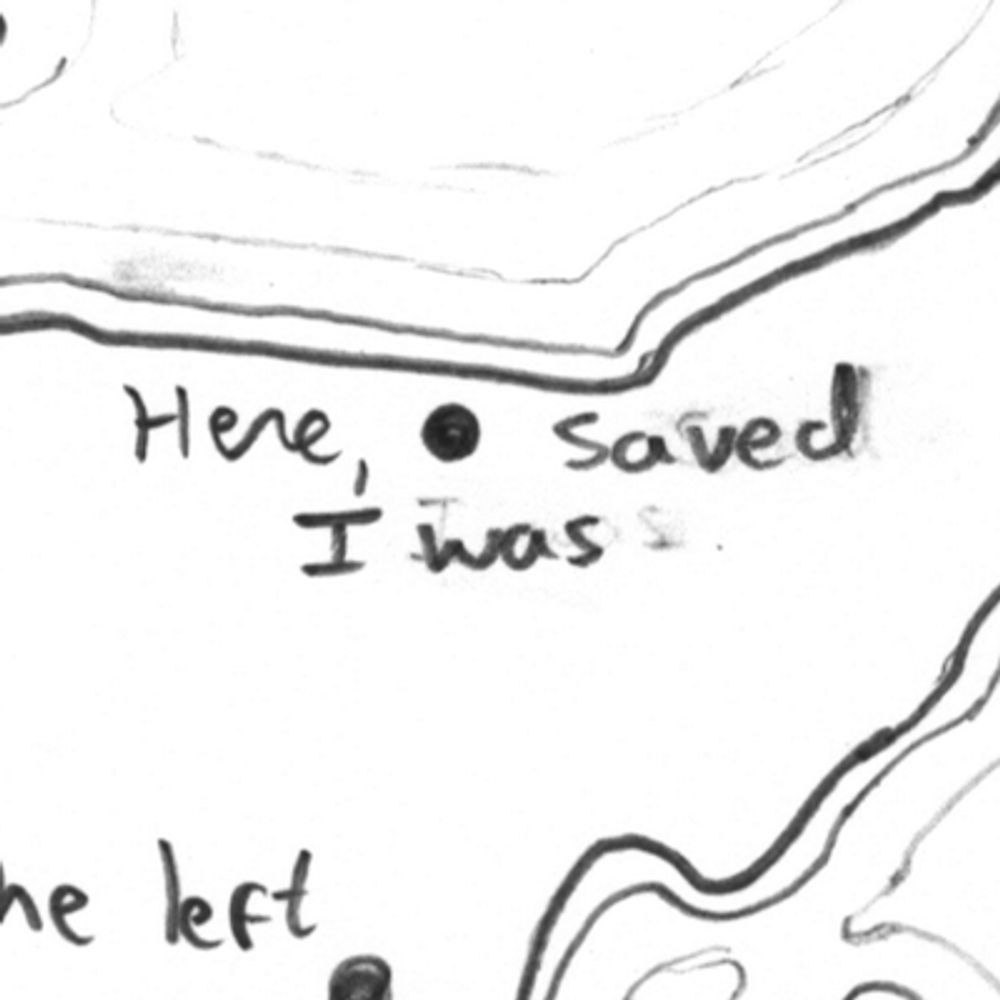
Labeling maps is a peaceful practice, and often is half the job of a cartographer. I'm sure seas will be drained and skies will be blackened so that AI can do it in our stead in a year or two, but for now, I always enjoy looking at a "map minus map" version of completed work.

January 10, 2026 at 2:36 AM
Labeling maps is a peaceful practice, and often is half the job of a cartographer. I'm sure seas will be drained and skies will be blackened so that AI can do it in our stead in a year or two, but for now, I always enjoy looking at a "map minus map" version of completed work.
A work-in-progress map of the Forests in the lower US. I haven't decided if I am going to display and label the National Parks and/or Forests yet. Things get pretty busy on the West Coast.
The legend is going to be a nightmare and I am not looking forward to it. 😂
#gis #gischat #cartography #map
The legend is going to be a nightmare and I am not looking forward to it. 😂
#gis #gischat #cartography #map

January 9, 2026 at 6:32 PM
A work-in-progress map of the Forests in the lower US. I haven't decided if I am going to display and label the National Parks and/or Forests yet. Things get pretty busy on the West Coast.
The legend is going to be a nightmare and I am not looking forward to it. 😂
#gis #gischat #cartography #map
The legend is going to be a nightmare and I am not looking forward to it. 😂
#gis #gischat #cartography #map
Reposted by Antonio Antoine

#Caracas 1936
Scale 1:5,000
Ministerio De Obras Publicas
Direccion de Cartografia Nacional
archive.org/details/WCWd...
A #cartographic gem from 90 years ago - worth the zoom in.
Scale 1:5,000
Ministerio De Obras Publicas
Direccion de Cartografia Nacional
archive.org/details/WCWd...
A #cartographic gem from 90 years ago - worth the zoom in.


January 8, 2026 at 12:06 AM
#Caracas 1936
Scale 1:5,000
Ministerio De Obras Publicas
Direccion de Cartografia Nacional
archive.org/details/WCWd...
A #cartographic gem from 90 years ago - worth the zoom in.
Scale 1:5,000
Ministerio De Obras Publicas
Direccion de Cartografia Nacional
archive.org/details/WCWd...
A #cartographic gem from 90 years ago - worth the zoom in.
Arizona Joy Plot Map
Testing out another method. Instead of applying the gradient across the entire feature layer, I applied a gradient to each individual plot line. This gives the plot lines a more 3D like effect. This is still a work in progress.
#gis #qgis #cartography #maps
Testing out another method. Instead of applying the gradient across the entire feature layer, I applied a gradient to each individual plot line. This gives the plot lines a more 3D like effect. This is still a work in progress.
#gis #qgis #cartography #maps

January 2, 2026 at 4:22 PM
Arizona Joy Plot Map
Testing out another method. Instead of applying the gradient across the entire feature layer, I applied a gradient to each individual plot line. This gives the plot lines a more 3D like effect. This is still a work in progress.
#gis #qgis #cartography #maps
Testing out another method. Instead of applying the gradient across the entire feature layer, I applied a gradient to each individual plot line. This gives the plot lines a more 3D like effect. This is still a work in progress.
#gis #qgis #cartography #maps
Reposted by Antonio Antoine

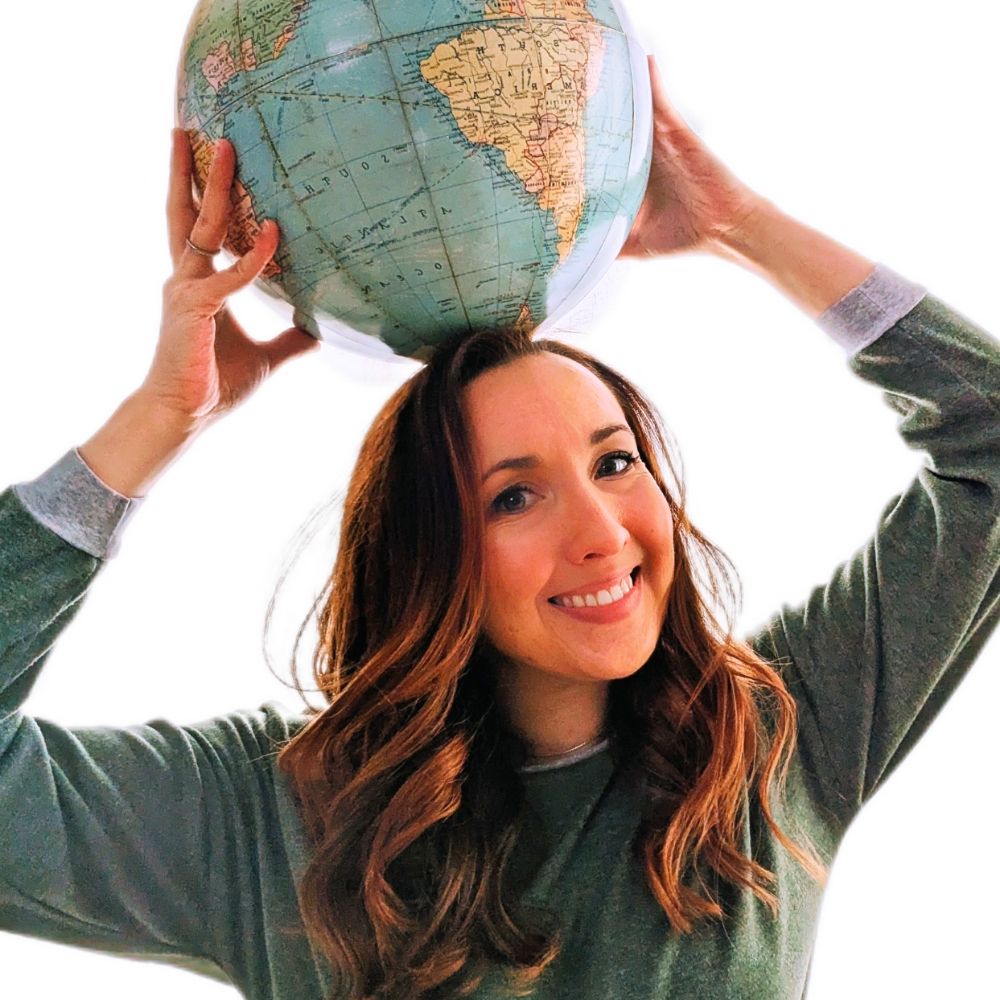
Happy Solstice and first official day of winter. More daylight each day now and spring is not far away.
a picture of the earth with the words winter solstice below it
ALT: a picture of the earth with the words winter solstice below it
media.tenor.com
December 21, 2025 at 2:32 PM
Happy Solstice and first official day of winter. More daylight each day now and spring is not far away.
Reposted by Antonio Antoine

Solstice on a Spinning Earth apod.nasa.gov/apod/ap25122...
Can you tell that today is a solstice by the tilt of the Earth? Yes. At a solstice, the Earth's terminator -- the dividing line between night and day -- is tilted the most.
Can you tell that today is a solstice by the tilt of the Earth? Yes. At a solstice, the Earth's terminator -- the dividing line between night and day -- is tilted the most.
December 21, 2025 at 8:20 AM
Solstice on a Spinning Earth apod.nasa.gov/apod/ap25122...
Can you tell that today is a solstice by the tilt of the Earth? Yes. At a solstice, the Earth's terminator -- the dividing line between night and day -- is tilted the most.
Can you tell that today is a solstice by the tilt of the Earth? Yes. At a solstice, the Earth's terminator -- the dividing line between night and day -- is tilted the most.
Reposted by Antonio Antoine

Man, I'm done with the days getting shorter! I am talking to MANAGEMENT. I will GET RESULTS. If the days get longer here on out, you'll know who to thank.
December 21, 2025 at 5:58 PM
Man, I'm done with the days getting shorter! I am talking to MANAGEMENT. I will GET RESULTS. If the days get longer here on out, you'll know who to thank.
Reposted by Antonio Antoine

Happy winter solstice. 📊

December 21, 2025 at 3:15 PM
Happy winter solstice. 📊
Today is the Winter Solstice, the longest night of the year for most of us living between the Equator and the Arctic Circle. The duration varies by latitude. Those living in the Arctic are experiencing Polar Night, which may have begun weeks ago!
Blog
antonioantoine.com/2025/12/17/t...
Blog
antonioantoine.com/2025/12/17/t...

December 21, 2025 at 3:48 PM
Today is the Winter Solstice, the longest night of the year for most of us living between the Equator and the Arctic Circle. The duration varies by latitude. Those living in the Arctic are experiencing Polar Night, which may have begun weeks ago!
Blog
antonioantoine.com/2025/12/17/t...
Blog
antonioantoine.com/2025/12/17/t...
Got my #NACIS Christmas tree ornament up! I think it is the only mappy ornament I have and I happened to win it at the 2025 conference.

December 18, 2025 at 1:41 PM
Got my #NACIS Christmas tree ornament up! I think it is the only mappy ornament I have and I happened to win it at the 2025 conference.
I am thinking about doing a state-level run of Joy Plot maps. I do think Virginia may have set the bar a little high. It looks like a mountain emerging from the fog.
#cartography #maps #qgis #gis
#cartography #maps #qgis #gis

December 15, 2025 at 3:00 PM
I am thinking about doing a state-level run of Joy Plot maps. I do think Virginia may have set the bar a little high. It looks like a mountain emerging from the fog.
#cartography #maps #qgis #gis
#cartography #maps #qgis #gis
Reposted by Antonio Antoine
If you enjoy both #RhodeIsland and #rivers, stop by The Map Center (@mapcenter.com) to check out (and maybe buy?) this poster I designed for them, showing the state's streams in the style of a transit network map.


December 10, 2025 at 8:18 PM
If you enjoy both #RhodeIsland and #rivers, stop by The Map Center (@mapcenter.com) to check out (and maybe buy?) this poster I designed for them, showing the state's streams in the style of a transit network map.
The #30DayMapChallenge is a wrap! I made a map quilt of my favorite Rhode Island maps from the challenge. I had to resize a few of them to get them all to line up. Had I planned this in advance, I would have alternated between light and dark maps.
#cartography
#cartography

December 10, 2025 at 5:28 PM
The #30DayMapChallenge is a wrap! I made a map quilt of my favorite Rhode Island maps from the challenge. I had to resize a few of them to get them all to line up. Had I planned this in advance, I would have alternated between light and dark maps.
#cartography
#cartography
Reposted by Antonio Antoine

Dark mode maps are attractive & engaging, but present design difficulties. It’s harder for us to parse light on dark than dark on light, and the way we interpret variation in lightness as differences in transparency compounds the difficulty.
📊🗺️🎨
From: www.bloomberg.com/graphics/202...
📊🗺️🎨
From: www.bloomberg.com/graphics/202...


December 9, 2025 at 5:18 PM
Dark mode maps are attractive & engaging, but present design difficulties. It’s harder for us to parse light on dark than dark on light, and the way we interpret variation in lightness as differences in transparency compounds the difficulty.
📊🗺️🎨
From: www.bloomberg.com/graphics/202...
📊🗺️🎨
From: www.bloomberg.com/graphics/202...
Reposted by Antonio Antoine
The official crowd sourced list of places you can buy carto-creations from is now live! Check out pokateomaps.com/mappygifts.
Let’s help folks shop small and support our mappy friends this holiday season!
Let’s help folks shop small and support our mappy friends this holiday season!

December 8, 2025 at 4:22 PM
The official crowd sourced list of places you can buy carto-creations from is now live! Check out pokateomaps.com/mappygifts.
Let’s help folks shop small and support our mappy friends this holiday season!
Let’s help folks shop small and support our mappy friends this holiday season!
I got maps to make, but the second shingles shot is kicking my ass. 🤒 Vaccines usually are pretty mild for me.
I don't have Spotify, but YouTube Music is trying to embarrass me with my listening habits of 2024. I am not sure how Draggin Around was my top song. lol. Everything else makes sense.
I don't have Spotify, but YouTube Music is trying to embarrass me with my listening habits of 2024. I am not sure how Draggin Around was my top song. lol. Everything else makes sense.

December 3, 2025 at 6:58 PM
I got maps to make, but the second shingles shot is kicking my ass. 🤒 Vaccines usually are pretty mild for me.
I don't have Spotify, but YouTube Music is trying to embarrass me with my listening habits of 2024. I am not sure how Draggin Around was my top song. lol. Everything else makes sense.
I don't have Spotify, but YouTube Music is trying to embarrass me with my listening habits of 2024. I am not sure how Draggin Around was my top song. lol. Everything else makes sense.
Introduce yourself with five cars you've owned.
Judging by the other responses, I might be one of the few "car guys" on here.
2003 Subaru WRX (Current)
2005 Subaru WRX STI
2009 Subaru WRX
2003 Audi A4
2005 Mustang
I clearly have a thing for the 2000s era. 😂
Judging by the other responses, I might be one of the few "car guys" on here.
2003 Subaru WRX (Current)
2005 Subaru WRX STI
2009 Subaru WRX
2003 Audi A4
2005 Mustang
I clearly have a thing for the 2000s era. 😂

Introduce yourself with five cars you've owned.
1) Honda Civic Hybrid
(That's it. That's the list.)
1) Honda Civic Hybrid
(That's it. That's the list.)

1 Fiesta (inherited, sold)
2 Lada Riva!
3 Corsa (written off by a neighbour dropping a TV on it from third floor window)
4 Fiesta (current car, 22 years old, growing moss)
Not planning to own a 5th.
2 Lada Riva!
3 Corsa (written off by a neighbour dropping a TV on it from third floor window)
4 Fiesta (current car, 22 years old, growing moss)
Not planning to own a 5th.
December 1, 2025 at 2:00 AM
Introduce yourself with five cars you've owned.
Judging by the other responses, I might be one of the few "car guys" on here.
2003 Subaru WRX (Current)
2005 Subaru WRX STI
2009 Subaru WRX
2003 Audi A4
2005 Mustang
I clearly have a thing for the 2000s era. 😂
Judging by the other responses, I might be one of the few "car guys" on here.
2003 Subaru WRX (Current)
2005 Subaru WRX STI
2009 Subaru WRX
2003 Audi A4
2005 Mustang
I clearly have a thing for the 2000s era. 😂
Day 29 - Raster
Rhode Island 24K Topo Maps
I have wanted to make a version of this map for some years now. TopoView was a big help in downloading the 24k topos. Clipping and stitching the 38 topos was a pita even with batch processing. I crashed QGIS a few times. lol
#30DayMapChallenge
Rhode Island 24K Topo Maps
I have wanted to make a version of this map for some years now. TopoView was a big help in downloading the 24k topos. Clipping and stitching the 38 topos was a pita even with batch processing. I crashed QGIS a few times. lol
#30DayMapChallenge

November 29, 2025 at 8:09 PM
Day 29 - Raster
Rhode Island 24K Topo Maps
I have wanted to make a version of this map for some years now. TopoView was a big help in downloading the 24k topos. Clipping and stitching the 38 topos was a pita even with batch processing. I crashed QGIS a few times. lol
#30DayMapChallenge
Rhode Island 24K Topo Maps
I have wanted to make a version of this map for some years now. TopoView was a big help in downloading the 24k topos. Clipping and stitching the 38 topos was a pita even with batch processing. I crashed QGIS a few times. lol
#30DayMapChallenge
Day 28 - Black
The Longest Nights (2025)
Polar night (+24 hr night) occurs just beyond the Arctic Circle. This is due to the Earth's gravitational pull on light. The ramp up from just beyond the Arctic Circle 67.4°N (24 hrs) to 67.5°N (11 days) is wild.
#30DayMapChallenge
The Longest Nights (2025)
Polar night (+24 hr night) occurs just beyond the Arctic Circle. This is due to the Earth's gravitational pull on light. The ramp up from just beyond the Arctic Circle 67.4°N (24 hrs) to 67.5°N (11 days) is wild.
#30DayMapChallenge

November 28, 2025 at 9:33 PM
Day 28 - Black
The Longest Nights (2025)
Polar night (+24 hr night) occurs just beyond the Arctic Circle. This is due to the Earth's gravitational pull on light. The ramp up from just beyond the Arctic Circle 67.4°N (24 hrs) to 67.5°N (11 days) is wild.
#30DayMapChallenge
The Longest Nights (2025)
Polar night (+24 hr night) occurs just beyond the Arctic Circle. This is due to the Earth's gravitational pull on light. The ramp up from just beyond the Arctic Circle 67.4°N (24 hrs) to 67.5°N (11 days) is wild.
#30DayMapChallenge
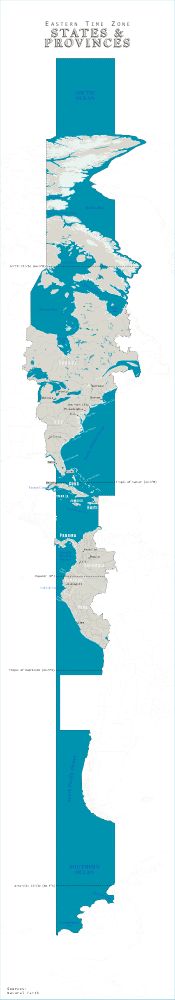
Day 27 - Boundaries
EST States & Provinces
How many states and provinces share the same time zone as Rhode Island?
#30DayMapChallenge
EST States & Provinces
How many states and provinces share the same time zone as Rhode Island?
#30DayMapChallenge
November 27, 2025 at 6:58 PM
Day 27 - Boundaries
EST States & Provinces
How many states and provinces share the same time zone as Rhode Island?
#30DayMapChallenge
EST States & Provinces
How many states and provinces share the same time zone as Rhode Island?
#30DayMapChallenge
Day 26 - Transport
Rhode Island Bike Lanes & Routes
I am not super happy with this one (don't hate either). I think it needs to bake for a few more hours. Maybe even a total redo. However, I am running low on time and creative energy. And this isn't my normal lane, lol.
#30DayMapChallenge
Rhode Island Bike Lanes & Routes
I am not super happy with this one (don't hate either). I think it needs to bake for a few more hours. Maybe even a total redo. However, I am running low on time and creative energy. And this isn't my normal lane, lol.
#30DayMapChallenge

November 26, 2025 at 9:51 PM
Day 26 - Transport
Rhode Island Bike Lanes & Routes
I am not super happy with this one (don't hate either). I think it needs to bake for a few more hours. Maybe even a total redo. However, I am running low on time and creative energy. And this isn't my normal lane, lol.
#30DayMapChallenge
Rhode Island Bike Lanes & Routes
I am not super happy with this one (don't hate either). I think it needs to bake for a few more hours. Maybe even a total redo. However, I am running low on time and creative energy. And this isn't my normal lane, lol.
#30DayMapChallenge
Day 25 - Hexagons
Rhode Island Dating Age Population Distribution
I have been thinking about making a national version of this map for some time now. The hue indicates whether a cell has more men or women (age 20-39). The hex size shows the cell pop density per 1 km (0.6 mi).
#30DayMapChallenge
Rhode Island Dating Age Population Distribution
I have been thinking about making a national version of this map for some time now. The hue indicates whether a cell has more men or women (age 20-39). The hex size shows the cell pop density per 1 km (0.6 mi).
#30DayMapChallenge

November 25, 2025 at 8:53 PM
Day 25 - Hexagons
Rhode Island Dating Age Population Distribution
I have been thinking about making a national version of this map for some time now. The hue indicates whether a cell has more men or women (age 20-39). The hex size shows the cell pop density per 1 km (0.6 mi).
#30DayMapChallenge
Rhode Island Dating Age Population Distribution
I have been thinking about making a national version of this map for some time now. The hue indicates whether a cell has more men or women (age 20-39). The hex size shows the cell pop density per 1 km (0.6 mi).
#30DayMapChallenge