Alessandro Vannini
@alessandrovannini.bsky.social
970 followers 680 following 4 posts
Head of Structural Biology Research Centre of Human Technopole, Milan Professor of Integrative Structural Biology. Our Team works on #RNAPolymeraseIII #SMC complexes and associated factors in genome function/organisation and viral sensing
Posts Media Videos Starter Packs
Reposted by Alessandro Vannini
spasqualato.bsky.social
. @zawarshah.bsky.social and @nikklena.bsky.social killing it at the Milan Joint Structural Biology Lab Meeting! Great afternoon gathering the Attu bio community in #uniMI
Amazing showcase of @humantechnopole.bsky.social science from @alessandrovannini.bsky.social and @gaiapigino.bsky.social lab
Reposted by Alessandro Vannini
mjafreeman.bsky.social
BlueSky has undergone a Cambrian explosion in the last week!

>20M users today: I can’t keep up with all the starter packs

I will continue to repost those I see...complete with collective nouns

But no pretence of being comprehensive

1/2
Reposted by Alessandro Vannini
harschnitz.bsky.social
For anything stem cell and pluripotency-related: go.bsky.app/UTW4d7b
Reposted by Alessandro Vannini
teiflab.bsky.social
Interesting new method to map nucleosomes in 3D, "Proximity Copy Paste (PCP)". www.biorxiv.org/content/10.1...
▶️ mapped connectivity of nucleosomes in S. cerevisiae
▶️ chromatin is predominantly organized into regularly spaced nucleosome arrays
▶️ metaphase chromosomes packed by arrayed cohesin hubs
PCP maps 3D genome organization at the nucleosome level.
(a) Schematic of the PCP reaction on chromatin. Crosslinked chromatin is digested into nucleosomes by Caspase Activated DNAse (CAD) and then immobilized onto magnetic beads. Digested chromatin is ligated by seed and receptor molecules to the ratio of 1/10. The PCP reaction takes place on the beads where RNA tags will diffuse from the seeds and tag nearby receptors. The chromatin is then decrosslinked, the proteins and RNA removed, and a sequencing library generated by PCR. Molecules sharing the same UMI are grouped. Tag groups can be analyzed in several ways, including individual multiway tag groups or pairwise interaction matrices. (b) Plot showing the relative frequency of receptor tagging as a function of distance from the seed, the midpoints of the tagged molecules is shown. Seeds that self-tag are excluded from this analysis. (c) Plot showing the number of reads per seed tag groups for G1 data. (d) Distance decay interaction plots of PCP (orange) and Micro-C (Costantinto et al. 2020, 15 min 23°C sample) (res = 50bp). Regularly spaced nucleosome arrays are prevalent over the genome.
(a) Meta analysis of PCP matrices relative to the dyad of the +1 nucleosome of genes longer than 2Kb, 50 least expressed genes (res = 10bp). (b) As a, but for the 50 most expressed genes (res = 10bp). (c) PCP map of low expressed gene RNR3 (middle, res = 25bp), Nucleosome profile (grey). Note the grid-like pattern across the entire gene body. (d) PCP map of the expressed gene FMP27 (res = 25bp), Nucleosome profile (grey). Note the grid-like pattern at the 5’ end of the gene and parallel stripes at towards the middle and 3’ end of gene. (e) Schematic of the results observed. No pattern is obtained with poorly spaced, poorly positioned nucleosomes. Dotted pattern is obtained with regularly spaced, well positioned nucleosome arrays. Striped pattern is obtained with regularly spaced delocalized arrays. The number of parallel stripes indicates the number of nucleosomes in the array. (f) Meta plot of highly transcribed, ribosomal protein genes. The genes are organized with respect to the Rap1 protein at position 0. Top panel, Rap1 ChIP-MNase in blue (Gutin et al. 2018), All reads size, Mono-nucleosomal (Nuc.) reads only and Sub-nucleosomal reads only (Sub. 20 bp < insert size < 90 bp) are represented. Medium panel represent the density of read by position relative to insert size from mapped PCP data. The bottom panel is a pile-up analysis of PCP matrix oriented relative to the RP genes (res = 10bp). Note that the gene body contains short, delocalized nucleosome arrays. (g) Frequency of tagging relative to the seed position for the subset of genes used in a and b. The most expressed genes are in red and least expressed genes in blue. (h) Frequency of tagging relative to the seed position for gene of at least 600bp. The most expressed are in orange and the least expressed is in blue.
Reposted by Alessandro Vannini
peiferlabunc.bsky.social
This is mind blowing! Sequencing DNA INSIDE single nuclei to map the 3D position of genes. I love the combination of technologies--imaging powered by expansion microscopy and state-of-the art sequencing, all underlain by good old Fred Sanger 🧪
zchiang.bsky.social
7 years ago, I met a junior fellow named Jason Buenrostro who blew me away with a vision of futuristic genomic technologies

Today, we (Ajay Labade, Caroline Comenho) are excited to share our first steps into that future: Expansion in situ genome sequencing

1/
alessandrovannini.bsky.social
Woahhhhhhhh ! Congratulations
Reposted by Alessandro Vannini
kjarmache.bsky.social
Please see our paper in Nature on read-write mechanisms of H2AK119 ubiquitination by Polycomb repressive complex I. Congrats to the whole team, especially Victoria and huge thanks to our collaborator JP Armache! Also big thanks to Mark Foundation for Cancer Research for the support! rdcu.be/dZ5HZ
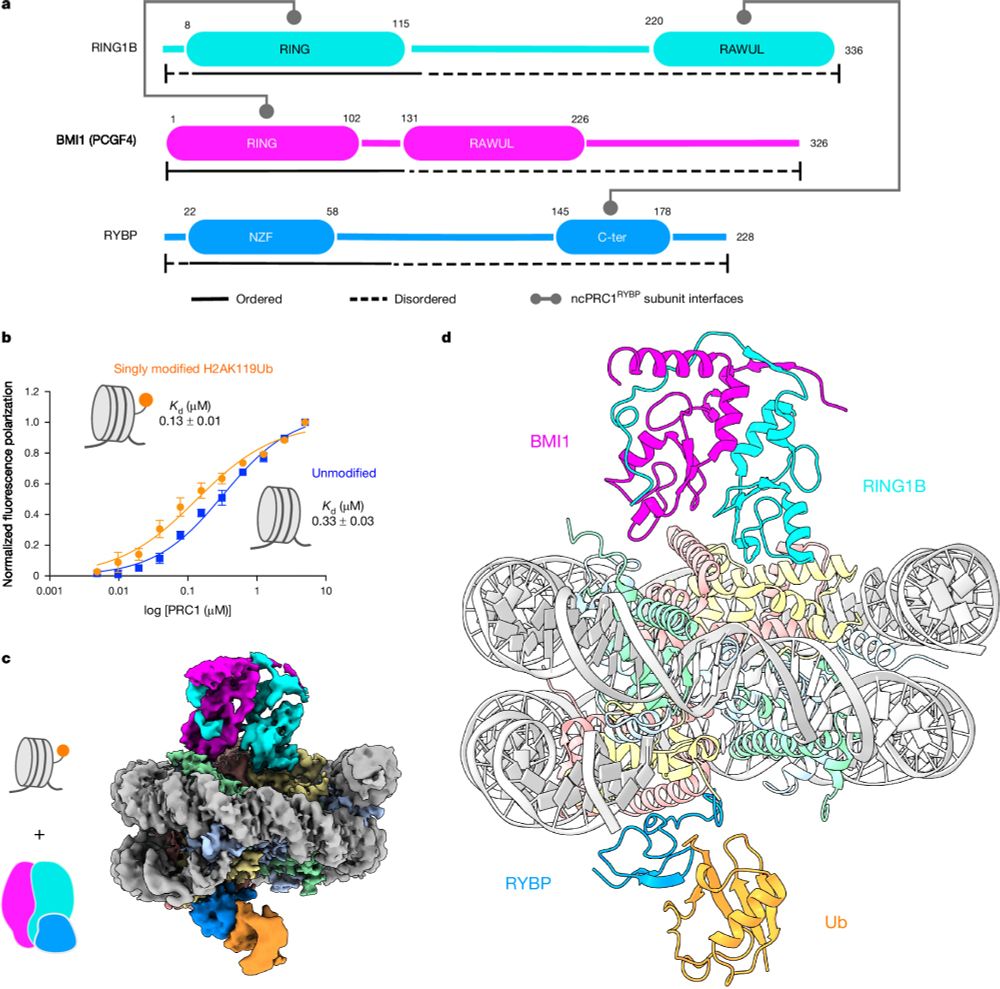
Read–write mechanisms of H2A ubiquitination by Polycomb repressive complex 1
Nature - Cryo-electron microscopy and biochemical studies elucidate the read–write mechanisms of non-canonical PRC1-containing RYBP in histone H2A lysine 119 monoubiquitination and their...
rdcu.be
Reposted by Alessandro Vannini
fronzeslab.bsky.social
FYI: I am trying to add people who post to the #cryoEM and #cryoET feeds to the CryoEM/ET starter pack.
alessandrovannini.bsky.social
Let’s give this platform a good go and hopefully say goodbye 👋 to the birdie one