Alex Lamers
@alexlamers.bsky.social
2.4K followers 440 following 350 posts
I try to make sense of the weather for a living. Remember, low probability events can and do happen.
Posts Media Videos Starter Packs
alexlamers.bsky.social
If you click on a city from the Urban Rain Rate Dashboard landing page map, you can explore the data for a specific city. In this example I clicked on Richmond, and set it for 1”/hr. Read more about the URRD in the Product Description Document: nsdesk.servicenowservices.com/api/g_noa/nw...
An example of what the city specific data explorer looks like in the Urban Rain Rate Dashboard from the Weather Prediction Center. Data may not be current by the time you see this.
alexlamers.bsky.social
Weather Prediction Center (WPC) has unveiled the experimental Urban Rain Rate Dashboard. It uses high-res model guidance to highlight where chances of intense rain rates are highest in major cities. It’s linked in “Forecast Tools” tab on the WPC home page. Direct link: www.wpc.ncep.noaa.gov/urrd/
A snapshot of the Urban Rain Rate Dashboard landing page from Friday morning, September 26, 2025, showing a map of the United States and color filled circles over major U.S. cities indicating the chance of intense rainfall in the next couple days. Data may not be current by the time you see this.
alexlamers.bsky.social
This is the way. (Although we certainly paid for it with the humidity in that shorter stretch.)
Reposted by Alex Lamers
climatologist49.bsky.social
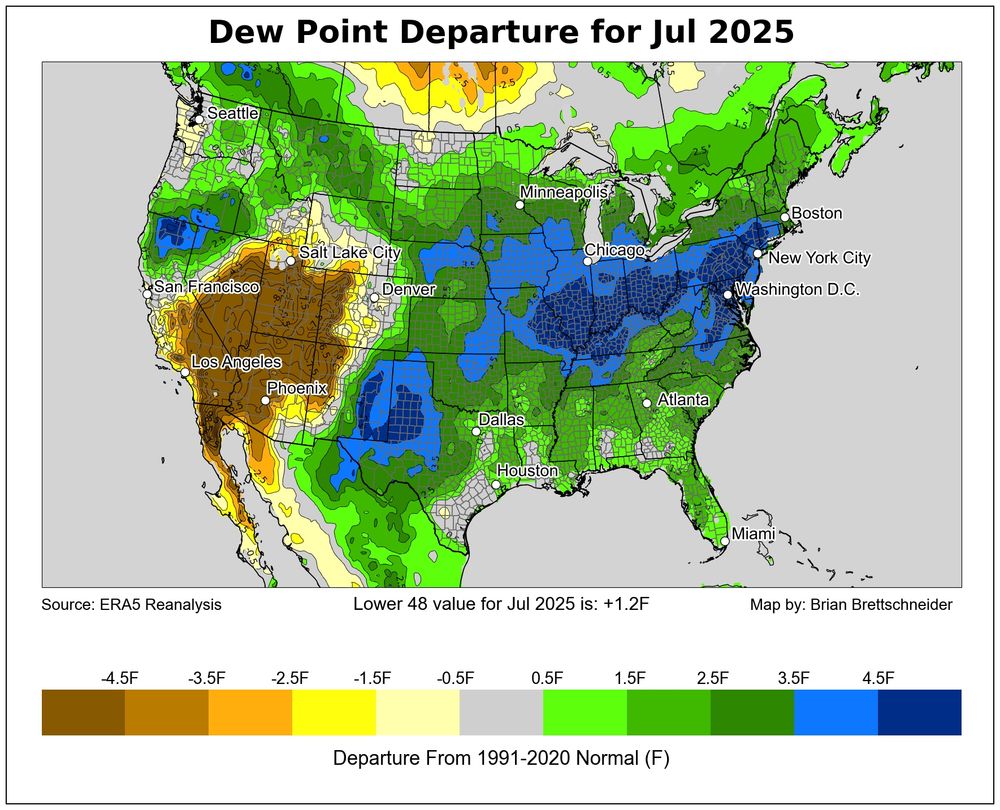
The average July 2025 dew point temperature for the Lower 48 was 1.2F above the 1991-2020 normal. Most areas of the map are dark green or blue - except for the very dry Southwest.
alexlamers.bsky.social
My app hadn’t updated or synced properly I guess, but I got it set up now. Thanks!
alexlamers.bsky.social
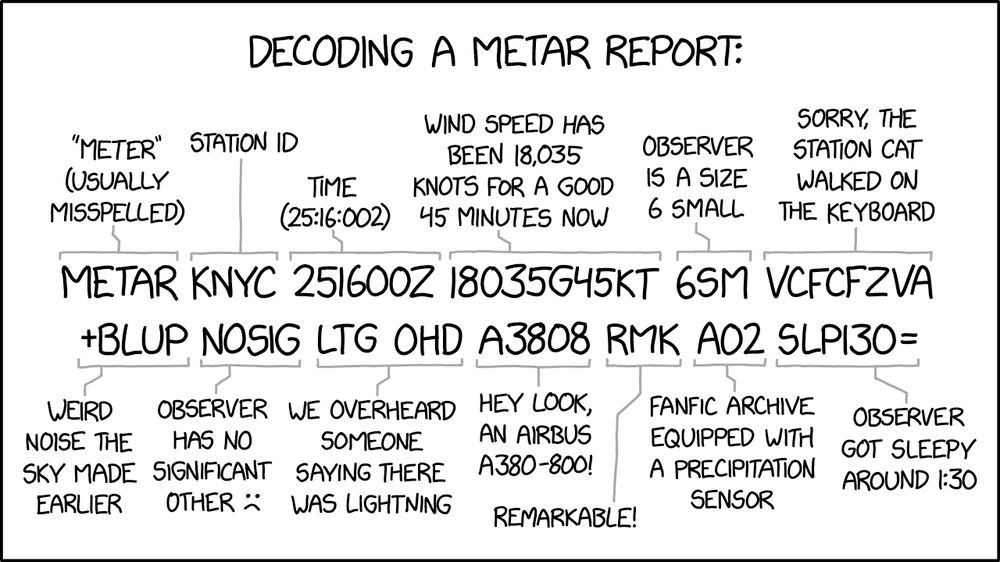
Curious how you get METARs in RadarScope; is it a higher tier or is there an add on I’m missing?
alexlamers.bsky.social
Or, to put it another way, July averages the most number of Flash Flood Warnings of any month (809, based on 2000-2024 counts), but we are basically at that number already (797, and counting…) in 2025 halfway through the month.
alexlamers.bsky.social
If it seems like there’s been a lot of flash flooding recently, the numbers back it up. The NWS issued the most number of Flash Flood Warnings on record (1,199) for the 30-day period from June 17 to July 16.

Yes, this is the peak of the usual flash flood season, but 2025 is more active than usual.
alexlamers.bsky.social
Paul Hollywood and Prue Leith are lodging an official protest
The New York Times Spelling Bee game saying claggy is not in the word list
Reposted by Alex Lamers
weatherkatie.bsky.social
DON'T EAT ICICLES 💩

This is your annual reminder that icicles can potentially have poop in them 😅
alexlamers.bsky.social
you gotta love some topical humor for your chosen profession
alexlamers.bsky.social
I got lucky and got it on the last guess but there were definitely still multiple possibilities.
Reposted by Alex Lamers
geoffnorcott.bsky.social
Massive away win for the little fella.
alexlamers.bsky.social
Today I’m thankful for the Packers fans sending their #mPING snow reports from Lambeau Field ❄️🏈
A radar image with mPING precip type reports overlaid, zoomed in on Green Bay, Wisconsin, and a couple snow icon reports at Lambeau Field
alexlamers.bsky.social
It looks beautiful and peaceful up there! Enjoy!
alexlamers.bsky.social
We record it and start 90 minutes late and just about catch up by the end. Helps to not only skip the ads but also the uninteresting interviews.
alexlamers.bsky.social
Given that many Great Lakes locations have had a Top 3 warmest autumn on record, this will be an abrupt introduction to winter. Not likely to see record cold, but could be coldest air since mid-late February. Weather whiplash! Hopefully folks traveling for Thanksgiving are packing appropriately!
alexlamers.bsky.social
First real blast of cold air this season on tap after Thanksgiving into the Great Lakes region. With all of the lakes at record warm levels for late November, the ingredients are there for some significant lake effect snow rates.
A GFS model forecast map for Friday afternoon over North America showing heights, winds, and temperature anomalies at 850 millibars.
alexlamers.bsky.social
👋 hello to Noah!
Reposted by Alex Lamers
weatherdak.bsky.social
Bomb cyclone goes boom.

An incredible view of the deepening low pressure system approaching the Pacific Northwest.
alexlamers.bsky.social
Congratulations Philippe!
alexlamers.bsky.social
I would send a note to our development branch if you want them to prioritize mobile functionality. This is the initial version, but it will be improved with time.
alexlamers.bsky.social
I think we have an archive of the bulletins somewhere but IEM is probably the most accessible. If you notice any gaps or issues, let me know!
Reposted by Alex Lamers
johnmoralestv.bsky.social
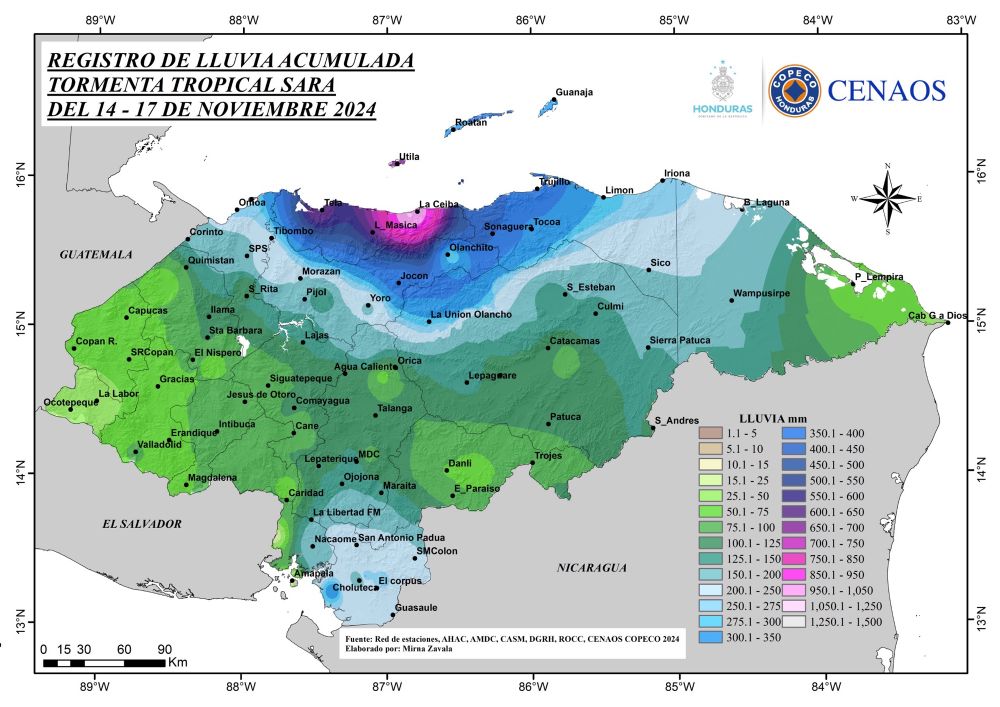
Storm total precipitation from Tropical Storm Sara in Honduras. More that 1000 millimeters (40 inches) in La Ceiba. (from COPECO)