
Gregor Gorjanc
@gregorgorjanc.bsky.social
390 followers
450 following
190 posts
Managing and improving populations using data science, genetics and breeding: @HighlanderLab, @RoslinInstitute, & @TheDickVet.
https://www.ed.ac.uk/roslin/highlanderlab
Posts
Media
Videos
Starter Packs

Reposted by Gregor Gorjanc

Reposted by Gregor Gorjanc

Reposted by Gregor Gorjanc


Reposted by Gregor Gorjanc

Reposted by Gregor Gorjanc

Reposted by Gregor Gorjanc

Reposted by Gregor Gorjanc

Hanbin Lee
@epigenci.bsky.social
· Sep 4


Reposted by Gregor Gorjanc

Hannes Becher
@h-a-n.bsky.social
· Aug 28

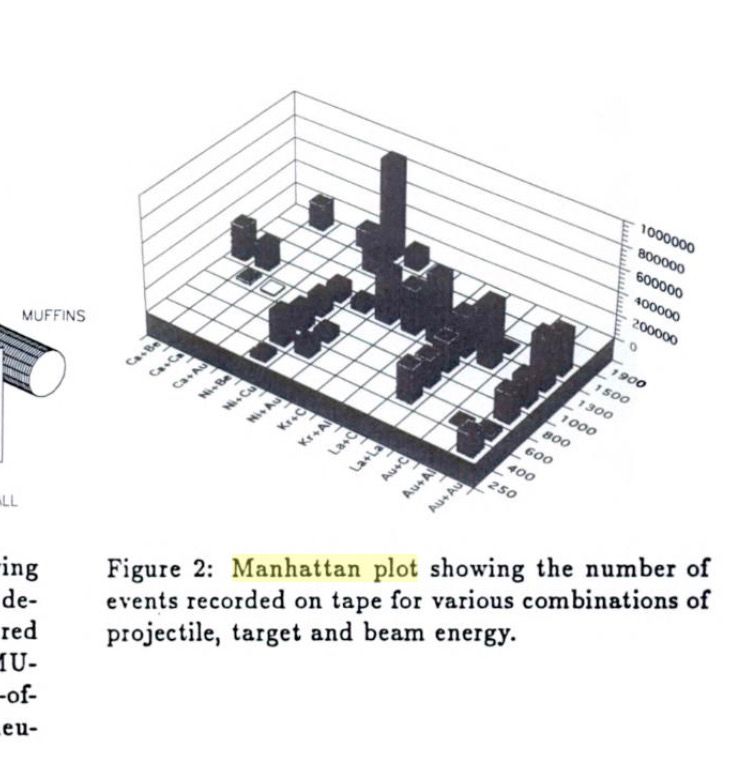
randPedPCA: rapid approximation of principal components from large pedigrees - Genetics Selection Evolution
Background Pedigrees continue to be extremely important in agriculture and conservation genetics, with the pedigrees of modern breeding programmes easily comprising millions of records. This size can ...
doi.org
Reposted by Gregor Gorjanc

Reposted by Gregor Gorjanc

Luis Apiolaza
@ojala.bsky.social
· Aug 26

Gregor Gorjanc
@gregorgorjanc.bsky.social
· Aug 21
Reposted by Gregor Gorjanc

Gregor Gorjanc
@gregorgorjanc.bsky.social
· Aug 11


Reposted by Gregor Gorjanc


Reposted by Gregor Gorjanc


Reposted by Gregor Gorjanc

Reposted by Gregor Gorjanc

Reposted by Gregor Gorjanc

Reposted by Gregor Gorjanc
Jonathan Pritchard
@jkpritch.bsky.social
· Jul 28
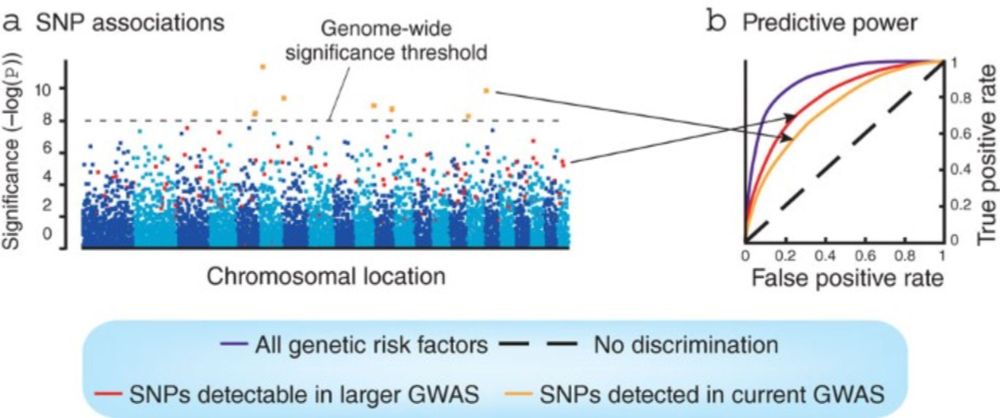
Hints of hidden heritability in GWAS - Nature Genetics
Although susceptibility loci identified through genome-wide association studies (GWAS) typically explain only a small proportion of the heritability, a classical quantitative genetic analysis now argu...
doi.org