Johannes Pilic
@johannes-pilic.bsky.social
760 followers
1.5K following
20 posts
Postdoc at ETH Zurich in the Kleele lab. I'm interested in mitochondria, microscopy and systems biology.
Posts
Media
Videos
Starter Packs
Pinned

Reposted by Johannes Pilic
Reposted by Johannes Pilic

Reposted by Johannes Pilic


Reposted by Johannes Pilic
Christian Frezza
@frezzalab.bsky.social
· Apr 29
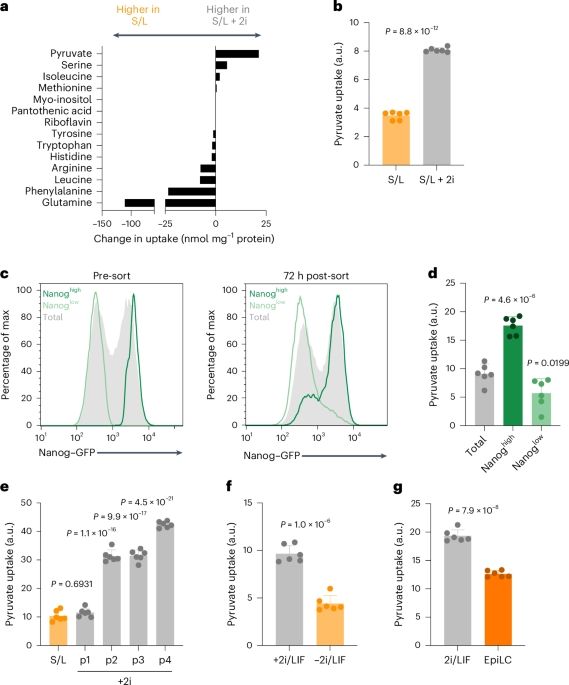
Intracellular metabolic gradients dictate dependence on exogenous pyruvate - Nature Metabolism
Jackson et al. provide insight into how metabolic adaptations that accompany cell state transitions drive reliance on exogenous nutrient availability, focusing on pyruvate as a key metabolite in centr...
www.nature.com
Reposted by Johannes Pilic
Christian Frezza
@frezzalab.bsky.social
· Apr 29
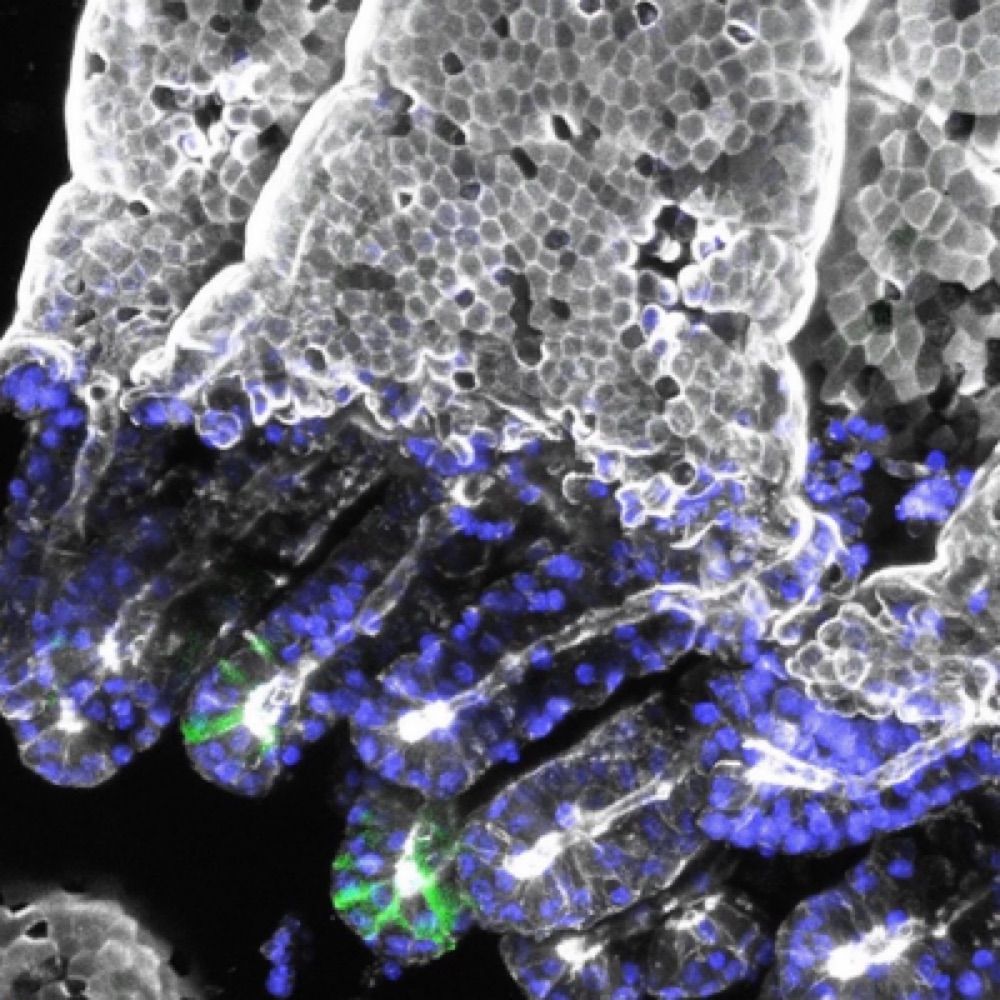
KatajistoLab
@katajistolab.bsky.social
· Apr 28
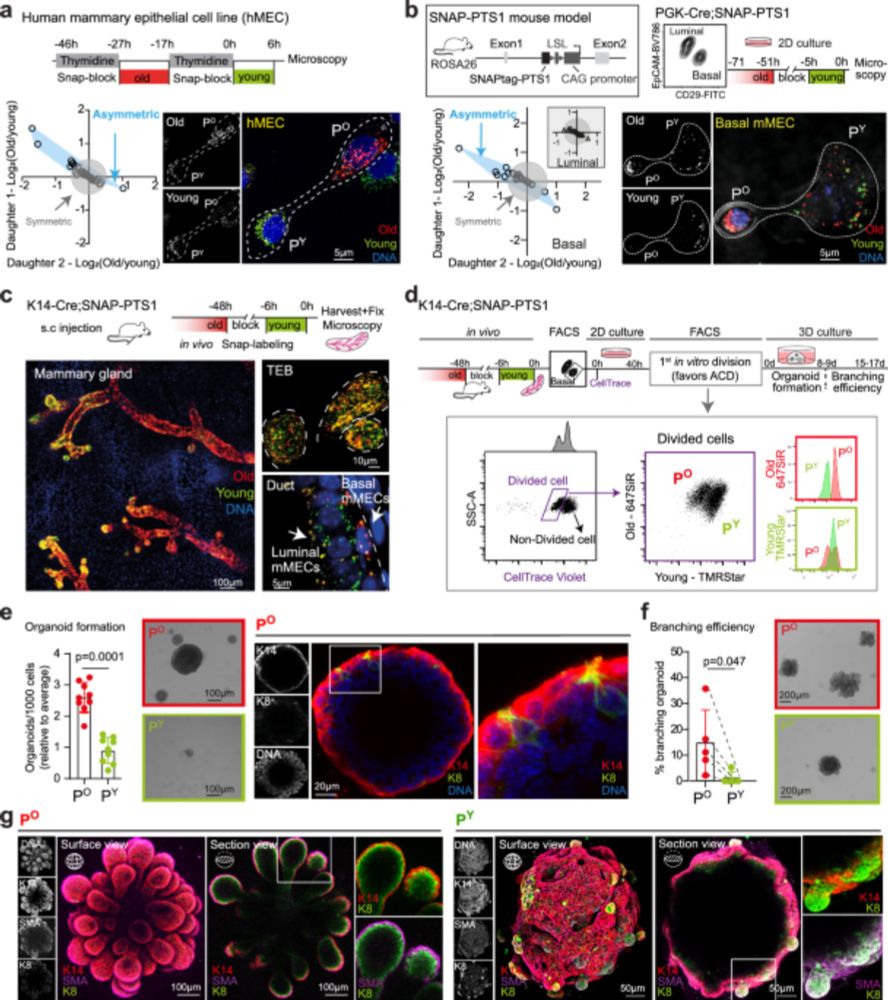
Glucose-6-phosphate-dehydrogenase on old peroxisomes maintains self-renewal of epithelial stem cells after asymmetric cell division - Nature Communications
Peroxisomes are essential but their role in cell fate regulation remains understudied. Here, the authors reveal that young and old peroxisomes are not equally distributed in asymmetrically dividing st...
www.nature.com
Reposted by Johannes Pilic


Reposted by Johannes Pilic

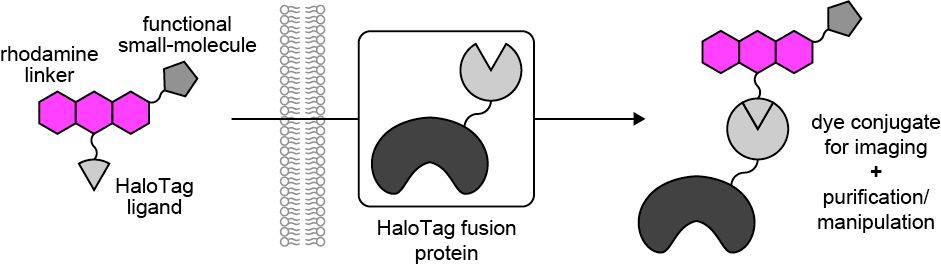
Kai Johnsson
@kjohnsson.bsky.social
· Feb 7

SiR-XActin: A fluorescent probe for imaging actin dynamics in live cells
Imaging actin-dependent processes in live cells is important for understanding numerous biological processes. However, currently used natural-product based fluorescent probes for actin filaments affec...
www.biorxiv.org
Reposted by Johannes Pilic
Christian Frezza
@frezzalab.bsky.social
· Mar 21
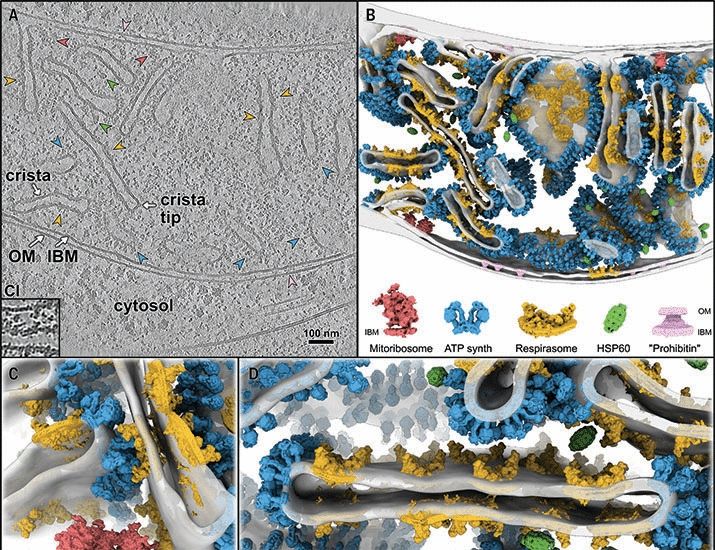
In-cell architecture of the mitochondrial respiratory chain
Mitochondria regenerate adenosine triphosphate (ATP) through oxidative phosphorylation. This process is carried out by five membrane-bound complexes collectively known as the respiratory chain, workin...
www.science.org
Reposted by Johannes Pilic
Reposted by Johannes Pilic
Reposted by Johannes Pilic
Reposted by Johannes Pilic
Reposted by Johannes Pilic

Flo Camus
@fcamus.bsky.social
· Jan 28
Reposted by Johannes Pilic

Reposted by Johannes Pilic

Reposted by Johannes Pilic