Ketil Isaksen
@ketilisaksen.bsky.social
520 followers 710 following 46 posts
Senior scientist at the Norwegian Meteorological Institute. Focusing on permafrost thermal dynamics and climate change in the Arctic and European mountain areas. Long-term permafrost monitoring
Posts Media Videos Starter Packs
Pinned
ketilisaksen.bsky.social
Our latest research investigates the remarkable heatwave that affected part of the Arctic in the summer of 2024. It caused a 1 percent loss in Svalbard's ice, making this region one of the most significant contributors to global sea-level rise last year www.pnas.org/doi/10.1073/...
PNAS
Proceedings of the National Academy of Sciences (PNAS), a peer reviewed journal of the National Academy of Sciences (NAS) - an authoritative source of high-impact, original research that broadly spans...
www.pnas.org
Reposted by Ketil Isaksen
aninehartmann.bsky.social
Jeg tror dette er godt kjent blant alle som jobber med planlegging i Norge: Vi er verst i Europa på å bygge ned natur.
NRK avslører europeisk naturtap: Norge topper verstingliste
www.nrk.no
Reposted by Ketil Isaksen
vaw-glaciology.bsky.social
Incredible ice loss measured again at #Konkordiaplatz on the #Aletsch #Glacier, home to the thickest ice in the #Alps (still about 800 m!). Yesterday’s survey revealed another –4.6 m of ice gone in just one year. :(
Measurements by @matthias-huss.bsky.social for GLAMOS
ketilisaksen.bsky.social
So in line with your results it may be reasonable that the high temperatures in August have been accompanied with enhanced drainage, thermal erosion and further subsidence, that intensified this rapid thaw and the collapse of the ice wedges
ketilisaksen.bsky.social
Many thanks for sharing, Frans-Jan! The results are very interesting. The previous winter brought more than normal of snow to the actual area, and even in August, there were still some snow patches, which resulted in a wetter tundra than normal.
ketilisaksen.bsky.social
Yes! It's remarkable to see these significant changes
ketilisaksen.bsky.social
Warming and thawing permafrost is confirmed by data from nearby monitoring stations. 2025 will be another bad year for the permafrost in Svalbard. Still some weeks left of the thawing season..
ketilisaksen.bsky.social
Thawing has intensified over the last few summers in Svalbard.
Thawing ice-wedge polygons in the continuous permafrost of Svalbard 78 °N, Aug 2025 Thawing ice-wedge polygons in the continuous permafrost of Svalbard 78 °N, Aug 2025
ketilisaksen.bsky.social
Witnessing the rapid and extensive thawing of permafrost in Svalbard is truly impressive but deeply concerning
ketilisaksen.bsky.social
Ice melt records set in 2020 and 2022 were just marginally greater than previous years, but an extreme and long Arctic heat wave last summer, intensified by weather patterns disrupted by climate change, opened a new page in the record books
insideclimatenews.org/news/1908202...
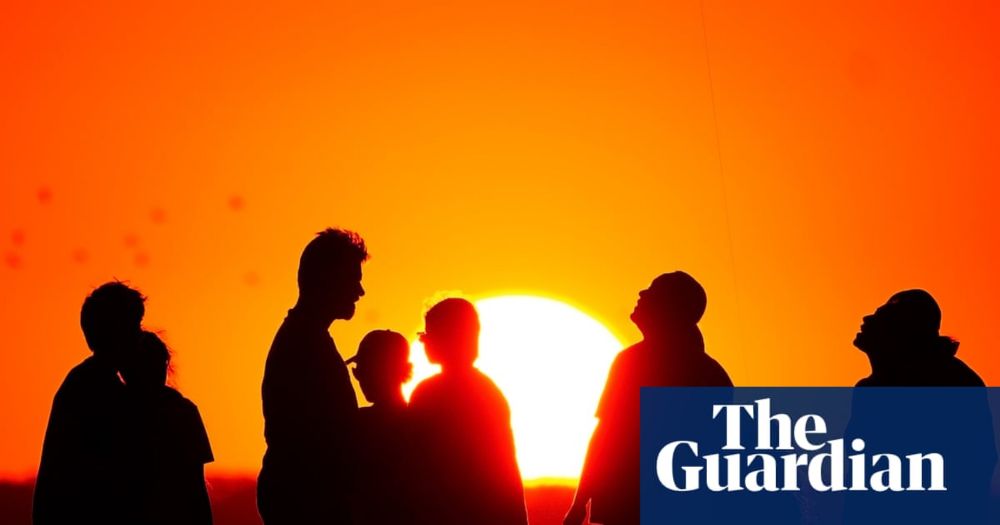
Melting on the Arctic’s Svalbard Islands Shows the Climate Future Is Now - Inside Climate News
The rapid disintegration of glaciers on the islands north of Norway foreshadows a catastrophic future for the Arctic, scientists warn.
insideclimatenews.org
Reposted by Ketil Isaksen
mikarantane.bsky.social
Summer 2024 featured unprecedented warmth in the European Arctic, causing melting of 1 % of the total ice volume on Svalbard.

Bad news is that in 2100 and even in the optimistic SSP1-2.6 emission scenario, 50% of the future summers will be warmer than 2024.

www.pnas.org/doi/10.1073/...
Fig. 4a of the paper. The caption of the paper: Projected temperature evolution until 2100. (A) shows JJA air temperature measured at Svalbard Airport (black) and corresponding downscaled statistics from CMIP6 multimodel ensembles for four different SSPs. The shaded regions mark the 5 to 95% CI for the respective SSP, and the solid lines show the ensemble means. The level of the observed value for 2024 is indicated by the horizontal dashed line, and the yellow horizontal bar indicates the mean value of the 1991–2020 climatology. Vertical bars indicate the time when the ensemble means reach the observed 2024 level. Fig. S3a of the paper. Cumulative CMB for all Svalbard glaciers for the season 2023/24 (blue), compared to the mean (black) and range of the 1991-2020 climatology (gray).
Reposted by Ketil Isaksen
jdkirkham.bsky.social
Shocking stats from this paper on the extreme 2024 summer heat in Arctic Svalbard, which lost 1% of its total ice volume in just ~6 weeks. 🔥

In fact, Svalbard's 2024 glacier mass loss actually exceeded that of the Greenland Ice Sheet, which is 50 times larger!!! 😱

www.pnas.org/doi/10.1073/...

❄️🧪🌊
Reposted by Ketil Isaksen
subfossilguy.bsky.social
2024 glacier loss in Svalbard was beyond imagination! 😱

- Anomaly of up to 4 SD!
- Amounts to ~61.7 Gt => 1% of the total ice volume
- Comparable to that of the Greenland ice sheet (55 Gt), which is 50 x larger!

... Otherworldly! 🪐

www.pnas.org/doi/10.1073/...
Svalbard’s 2024 record summer: An early view of Arctic glacier meltdown? | PNAS
A record-breaking melt season affected the Arctic glaciers of Svalbard in summer 2024 by a substantial margin. Across the entire archipelago, glaci...
www.pnas.org
ketilisaksen.bsky.social
Thank you, Mika! The research was established through a exciting collaboration between the University of Oslo, the Norwegian Polar Institute, the Norwegian Mapping Authority, and the Norwegian Meteorological Institute @uio.no @npiglaciology.bsky.social @met.no
ketilisaksen.bsky.social
Our latest research investigates the remarkable heatwave that affected part of the Arctic in the summer of 2024. It caused a 1 percent loss in Svalbard's ice, making this region one of the most significant contributors to global sea-level rise last year www.pnas.org/doi/10.1073/...
PNAS
Proceedings of the National Academy of Sciences (PNAS), a peer reviewed journal of the National Academy of Sciences (NAS) - an authoritative source of high-impact, original research that broadly spans...
www.pnas.org
ketilisaksen.bsky.social
This July reminded us that in the north, heat is not a distant threat but is seeping into hospitals, care facilities & homes. Our infrastructure was not built to withstand these extreme temperatures and our population is increasingly susceptible to dangerous heat www.theguardian.com/environment/...
‘No country is safe’: deadly Nordic heatwave supercharged by climate crisis, scientists say
Historically cool nations saw hospitals overheating and surge in drownings, wildfires and toxic algal blooms
www.theguardian.com
Reposted by Ketil Isaksen
matthias-huss.bsky.social
Getting used to this image: #glaciers almost completely naked - unprotected by the white snow - in August...
While July was good for glaciers after record-melt in June, the new heat wave again results in major ice loss
@vaw-glaciology.bsky.social
Reposted by Ketil Isaksen
wxnb.bsky.social
This is unbelievable.

The high temperature at one of Finland’s northernmost weather stations, in the municipality of Sodankylä (Lapland region) within the Arctic Circle at latitude 67.3°N, reached at least 25°C for 26 days in a row.

Records date back to 1908.
Reposted by Ketil Isaksen
mikarantane.bsky.social
Inspired by @ketilisaksen.bsky.social post, I did the same analysis for Finland.

In terms of 14-day average temperatures, the 2025 heatwave in Finland did not quite surpass the well-known 1972 and 2018 heatwaves.

This is based on 10 km gridded observations.
Bar chart showing the top ten warmest 14-day periods in Finland, as measured by area average temperature for Finland. The data is based FMI ClimGrid temperature which is gridded 10 km dataset for Finland.
Reposted by Ketil Isaksen
signeaaboe.bsky.social
Disregarding the extreme and record-low sea-ice extent in Antarctic the last two years, this year's July extent is exceptionally low, ranking as the 3rd lowest on record.

The July extent over the last four years differs significantly from that of the previous four decades.

@osi-saf.eumetsat.int
Map showing the Antarctic anomaly of the July 2025 sea-ice concentration relative to the mean July ice concentration in 1981-2010. Especially, the sea ice around the Antarctic Peninsula, and in the King Haakon VII sea, shows large areas of negative anomaly (red colour).
Source data is OSI SAF sea-ice concentration CDR v3.0. The line graph displays the monthly sea-ice extent in the Antarctic for July from 1979 to 2025. In 2025, the July extent ranked as the third lowest on record.
Source data is OSI SAF sea-ice index.