Alexey Nesvizhskii
@nesvilab.bsky.social
1.2K followers
170 following
43 posts
Godfrey D. Stobbe Professor of Bioinformatics at U of Michigan. Trained as a theoretical physicist, now focusing on proteomics and proteogenomics. https://fragpipe.nesvilab.org/
Posts
Media
Videos
Starter Packs
Pinned


Reposted by Alexey Nesvizhskii
Reposted by Alexey Nesvizhskii


Alexey Nesvizhskii
@nesvilab.bsky.social
· Aug 20

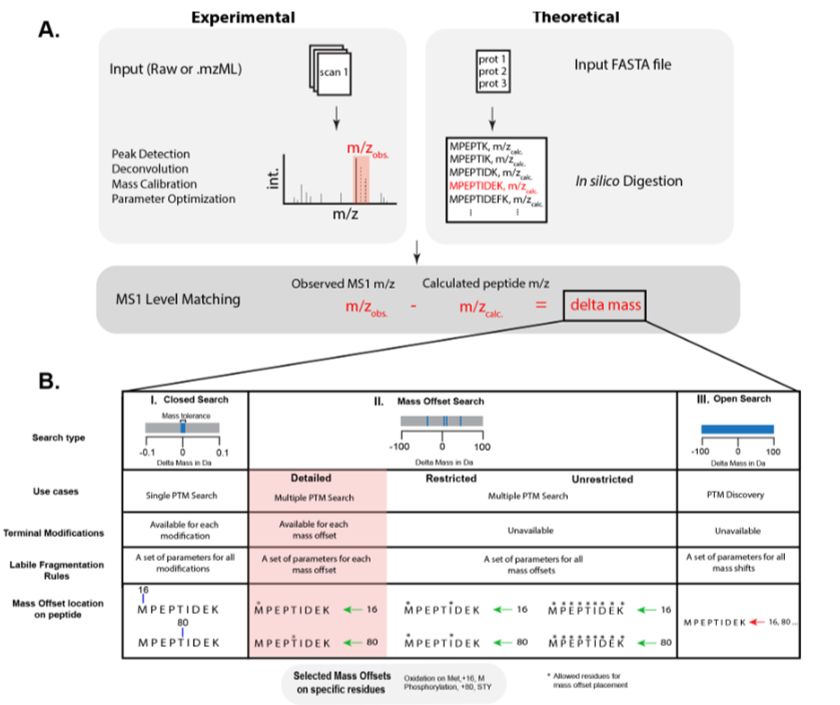
Crystal-C: A Computational Tool for Refinement of Open Search Results
Shotgun proteomics using liquid chromatography coupled to mass spectrometry (LC-MS) is commonly used to identify peptides containing post-translational modifications. With the emergence of fast databa...
pubs.acs.org
Alexey Nesvizhskii
@nesvilab.bsky.social
· Aug 20

Nucleoside diphosphate kinase A (NME1) catalyses its own oligophosphorylation - Nature Chemistry
Our understanding of how post-translational modification—protein phosphorylation—impacts the complexity of eukaryotic signalling pathways is continuously expanding. Now, protein oligophosphorylation h...
www.nature.com
Reposted by Alexey Nesvizhskii
Alison Chaves
@alisonchaves.bsky.social
· Aug 15

PSManalyst: A Dashboard for Visual Quality Control of FragPipe Results
FragPipe is recognized as one of the fastest computational platforms in proteomics, making it a practical solution for the rapid quality control of high-throughput sample analyses. Starting with version 23.0, FragPipe introduced the “Generate Summary Report” feature, offering .pdf reports with essential quality control metrics to address the challenge of intuitively assessing large-scale proteomics data. While traditional spreadsheet formats (e.g., tsv files) are accessible, the complexity of the data often limits user-friendly interpretation. To further enhance accessibility, PSManalyst, a Shiny-based R application, was developed to process FragPipe output files (psm.tsv, protein.tsv, and combined_protein.tsv) and provide interactive, code-free data visualization. Users can filter peptide-spectrum matches (PSMs) by quality scores, visualize protease cleavage fingerprints as heatmaps and SeqLogos, and access a range of quality control metrics and representations such as peptide length distributions, ion densities, mass errors, and wordclouds for overrepresented peptides. The tool facilitates seamless switching between PSM and protein data visualization, offering insights into protein abundance discrepancies, samplewise similarity metrics, protein coverage, and contaminants evaluation. PSManalyst leverages several R libraries (lsa, vegan, ggfortify, ggseqlogo, wordcloud2, tidyverse, ggpointdensity, and plotly) and runs on Windows, MacOS, and Linux, requiring only a local R setup and an IDE. The app is available at (https://github.com/41ison/PSManalyst.
pubs.acs.org


Alexey Nesvizhskii
@nesvilab.bsky.social
· Jul 24

Reposted by Alexey Nesvizhskii


Reposted by Alexey Nesvizhskii

Phil W
@pwilmarth.bsky.social
· Jul 4
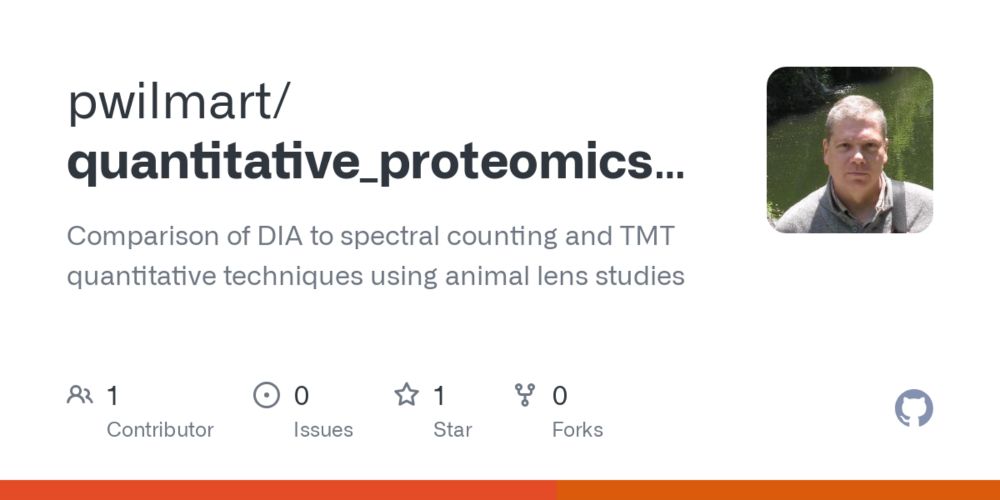
GitHub - pwilmart/quantitative_proteomics_comparison: Comparison of DIA to spectral counting and TMT quantitative techniques using animal lens studies
Comparison of DIA to spectral counting and TMT quantitative techniques using animal lens studies - pwilmart/quantitative_proteomics_comparison
github.com
Alexey Nesvizhskii
@nesvilab.bsky.social
· Jun 14
Alexey Nesvizhskii
@nesvilab.bsky.social
· May 23
Kusterlab
@kusterlab.bsky.social
· May 22
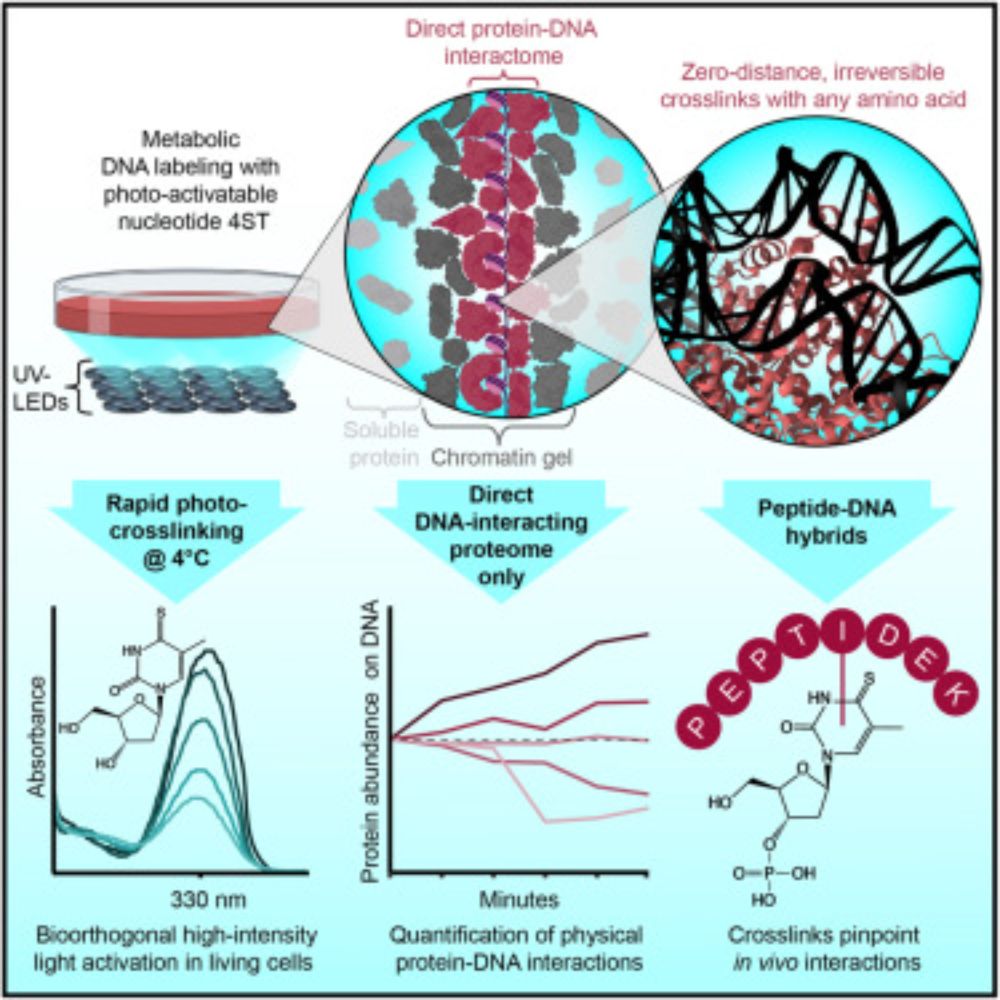
The human proteome with direct physical access to DNA
Zero-distance photo-crosslinking reveals direct protein-DNA interactions in living
cells, enabling quantitative analysis of the DNA-interacting proteome on a timescale
of minutes with single-amino-aci...
www.cell.com
Reposted by Alexey Nesvizhskii


Alexey Nesvizhskii
@nesvilab.bsky.social
· May 15

Reposted by Alexey Nesvizhskii