


Stay up to date with all our latest articles by subscribing to The OWID Brief newsletter: ourworldindata.org/subscribe

Subscribe to Our World in Data
Stay up to date with our latest research and data insights by subscribing to our newsletter.
ourworldindata.org
December 12, 2025 at 10:11 AM
Stay up to date with all our latest articles by subscribing to The OWID Brief newsletter: ourworldindata.org/subscribe

Ollie: I no lyk dem bein owid to Woodoff eiva Woofy 🥺😢 #tweetchoir 🎄
December 8, 2025 at 8:24 PM
Ollie: I no lyk dem bein owid to Woodoff eiva Woofy 🥺😢 #tweetchoir 🎄
Ollie: aww Woodoff 🫎 🎶🎵🎶
Woodoff da wednose weyndeer ad a vewy shiny nose
N if yoo eva saw it yoo wud evin sed it glowd
All da ova weyndeer
Usd to lawf n kall I'm nayms ( ow owid uv dem 🥺)
Dey neva let paw Woodoff
Joyn in eny weyndeer games ( well dat b jus orful )
#tweetchoir 🎄
Woodoff da wednose weyndeer ad a vewy shiny nose
N if yoo eva saw it yoo wud evin sed it glowd
All da ova weyndeer
Usd to lawf n kall I'm nayms ( ow owid uv dem 🥺)
Dey neva let paw Woodoff
Joyn in eny weyndeer games ( well dat b jus orful )
#tweetchoir 🎄
December 8, 2025 at 8:16 PM
Ollie: aww Woodoff 🫎 🎶🎵🎶
Woodoff da wednose weyndeer ad a vewy shiny nose
N if yoo eva saw it yoo wud evin sed it glowd
All da ova weyndeer
Usd to lawf n kall I'm nayms ( ow owid uv dem 🥺)
Dey neva let paw Woodoff
Joyn in eny weyndeer games ( well dat b jus orful )
#tweetchoir 🎄
Woodoff da wednose weyndeer ad a vewy shiny nose
N if yoo eva saw it yoo wud evin sed it glowd
All da ova weyndeer
Usd to lawf n kall I'm nayms ( ow owid uv dem 🥺)
Dey neva let paw Woodoff
Joyn in eny weyndeer games ( well dat b jus orful )
#tweetchoir 🎄

OWID loves doing the 'things are WAY better than they were several millennia ago!!!!' chart and I'm never sure what exactly I'm meant to be taking away from it

Currently dorking out over this graph about child mortality with my brother. Just mind boggling to take in.

December 2, 2025 at 9:19 AM
OWID loves doing the 'things are WAY better than they were several millennia ago!!!!' chart and I'm never sure what exactly I'm meant to be taking away from it
In The OWID Brief newsletter, we have a section where our team writes about interesting things we've been reading lately.
In today's edition, we wrote about articles in Transformer and VoxDev:
www.transformernews.ai/p/claude-son...
voxdev.org/topic/trade/...
In today's edition, we wrote about articles in Transformer and VoxDev:
www.transformernews.ai/p/claude-son...
voxdev.org/topic/trade/...

November 28, 2025 at 5:19 PM
In The OWID Brief newsletter, we have a section where our team writes about interesting things we've been reading lately.
In today's edition, we wrote about articles in Transformer and VoxDev:
www.transformernews.ai/p/claude-son...
voxdev.org/topic/trade/...
In today's edition, we wrote about articles in Transformer and VoxDev:
www.transformernews.ai/p/claude-son...
voxdev.org/topic/trade/...

This (PUBLISHED!) paper is gaga: Hold on tight, all from world OWID data!
- vax cannot have saved lives: excess was higher in 2021 than 2020 so 2021 excess is from vax
- 40% of the pop was vaxed so 40% of deaths was vaxed
Ergo: vaxed had 15% higher mortality than unvaxed🤪
- vax cannot have saved lives: excess was higher in 2021 than 2020 so 2021 excess is from vax
- 40% of the pop was vaxed so 40% of deaths was vaxed
Ergo: vaxed had 15% higher mortality than unvaxed🤪

November 26, 2025 at 6:48 PM
This (PUBLISHED!) paper is gaga: Hold on tight, all from world OWID data!
- vax cannot have saved lives: excess was higher in 2021 than 2020 so 2021 excess is from vax
- 40% of the pop was vaxed so 40% of deaths was vaxed
Ergo: vaxed had 15% higher mortality than unvaxed🤪
- vax cannot have saved lives: excess was higher in 2021 than 2020 so 2021 excess is from vax
- 40% of the pop was vaxed so 40% of deaths was vaxed
Ergo: vaxed had 15% higher mortality than unvaxed🤪

if anyone gets mad at this i’m just going to tap the OWID sign and otherwise ignore you
bsky.app/profile/esca...
bsky.app/profile/esca...


November 24, 2025 at 4:47 PM
if anyone gets mad at this i’m just going to tap the OWID sign and otherwise ignore you
bsky.app/profile/esca...
bsky.app/profile/esca...
📨 The OWID Brief newsletter keeps you up to date on all of our work, plus curated highlights from across Our World in Data and beyond — delivered right to your inbox twice a month.
November 14, 2025 at 2:12 PM
📨 The OWID Brief newsletter keeps you up to date on all of our work, plus curated highlights from across Our World in Data and beyond — delivered right to your inbox twice a month.

Ich spiele ja gerne mit den Chart-Funktionen von #OWiD herum, weil ich die sehr gelungen finde.
Hier ein besonders aussagekräftiges Beispiel zur Entwicklung der #Stromerzeugung nach Erzeugungsart seit 2000 (erzeugte Menge, nicht installierte Leistung!).
ourworldindata.org/grapher/elec...
Hier ein besonders aussagekräftiges Beispiel zur Entwicklung der #Stromerzeugung nach Erzeugungsart seit 2000 (erzeugte Menge, nicht installierte Leistung!).
ourworldindata.org/grapher/elec...

October 27, 2025 at 7:52 AM
Ich spiele ja gerne mit den Chart-Funktionen von #OWiD herum, weil ich die sehr gelungen finde.
Hier ein besonders aussagekräftiges Beispiel zur Entwicklung der #Stromerzeugung nach Erzeugungsart seit 2000 (erzeugte Menge, nicht installierte Leistung!).
ourworldindata.org/grapher/elec...
Hier ein besonders aussagekräftiges Beispiel zur Entwicklung der #Stromerzeugung nach Erzeugungsart seit 2000 (erzeugte Menge, nicht installierte Leistung!).
ourworldindata.org/grapher/elec...

Hello @maxroser.bsky.social and @scientificdiscovery.dev Hope you don't mind, but I made a bot to post the Our World in Data Daily insight on Bluesky.
bsky.app/profile/owid...
bsky.app/profile/owid...
September 30, 2024 at 12:25 PM
Hello @maxroser.bsky.social and @scientificdiscovery.dev Hope you don't mind, but I made a bot to post the Our World in Data Daily insight on Bluesky.
bsky.app/profile/owid...
bsky.app/profile/owid...
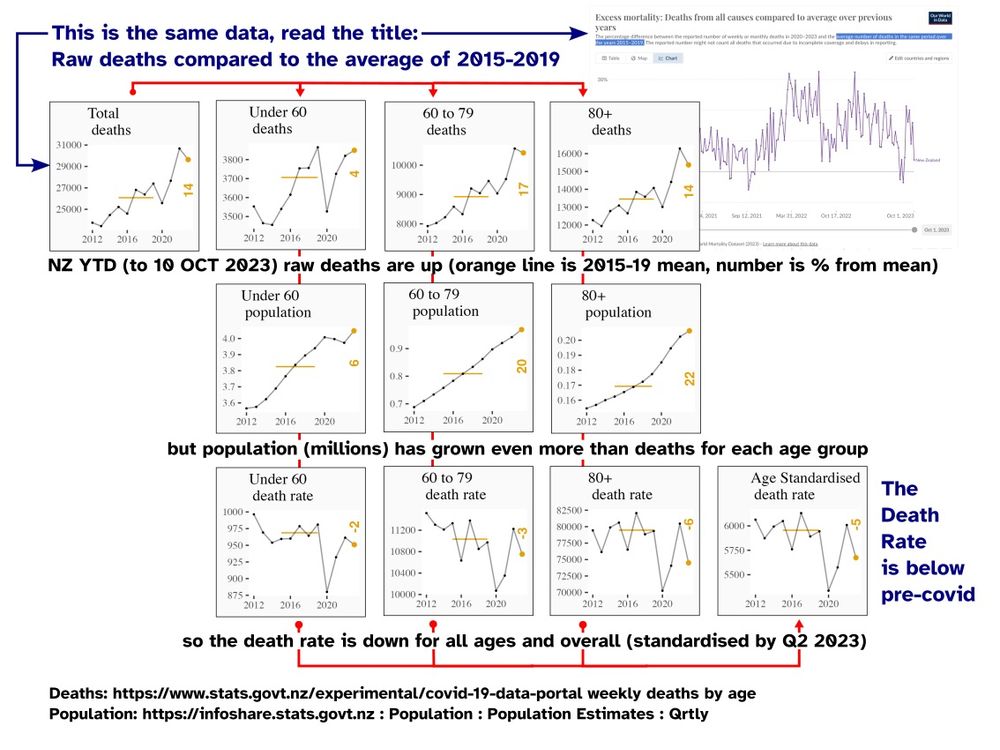
Nah, that is just his monthly showing a graph that compares current raw deaths with the average of 2015-2019 ignoring population growth and ageing and suggesting it is a mystery. Happens regularly. That is what this figure was made to deconstruct to show the death rate for every age is lower.
November 28, 2023 at 9:39 AM
Nah, that is just his monthly showing a graph that compares current raw deaths with the average of 2015-2019 ignoring population growth and ageing and suggesting it is a mystery. Happens regularly. That is what this figure was made to deconstruct to show the death rate for every age is lower.

🧵2/7
Became a huge fan of Counterpunch c/o their takedown of OWID:
www.counterpunch.org/2024/07/26/t...
Completely weirded out that Joshua Frank of Counterpunch fame wrote an article about wind farms murdering birds. Yes, it's supporting the fossil fuel industry.
Became a huge fan of Counterpunch c/o their takedown of OWID:
www.counterpunch.org/2024/07/26/t...
Completely weirded out that Joshua Frank of Counterpunch fame wrote an article about wind farms murdering birds. Yes, it's supporting the fossil fuel industry.
January 24, 2025 at 10:59 AM
🧵2/7
Became a huge fan of Counterpunch c/o their takedown of OWID:
www.counterpunch.org/2024/07/26/t...
Completely weirded out that Joshua Frank of Counterpunch fame wrote an article about wind farms murdering birds. Yes, it's supporting the fossil fuel industry.
Became a huge fan of Counterpunch c/o their takedown of OWID:
www.counterpunch.org/2024/07/26/t...
Completely weirded out that Joshua Frank of Counterpunch fame wrote an article about wind farms murdering birds. Yes, it's supporting the fossil fuel industry.

It's a sobering statistical chart, but might not be that bad. Risk up around 0.5% before dropping right down.
Worth looking through the OWiD original, I've added Finland and China as comparators, Finland up around 1% @1850, then drops to match UK:
ourworldindata.org/grapher/mate...
Worth looking through the OWiD original, I've added Finland and China as comparators, Finland up around 1% @1850, then drops to match UK:
ourworldindata.org/grapher/mate...
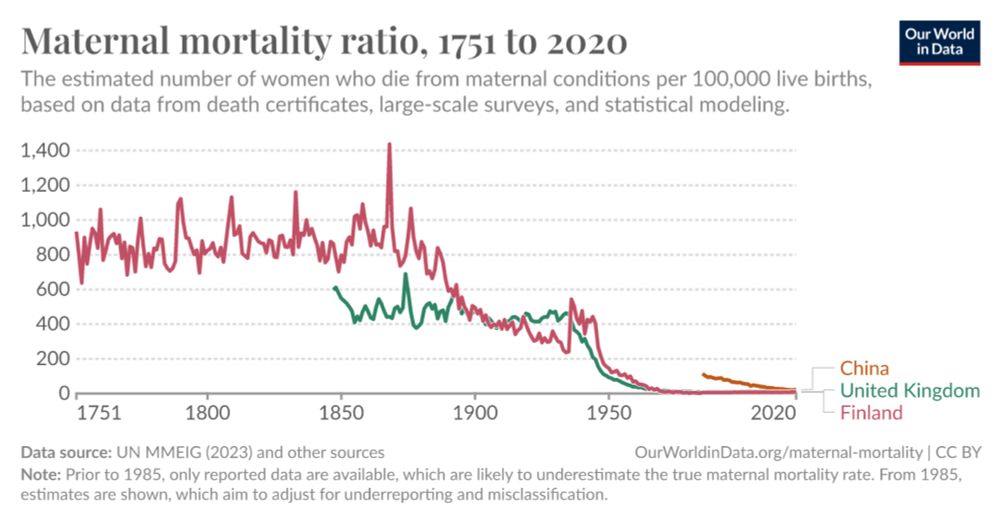
Maternal mortality ratio
An interactive visualization from Our World in Data.
ourworldindata.org
September 28, 2024 at 9:43 PM
It's a sobering statistical chart, but might not be that bad. Risk up around 0.5% before dropping right down.
Worth looking through the OWiD original, I've added Finland and China as comparators, Finland up around 1% @1850, then drops to match UK:
ourworldindata.org/grapher/mate...
Worth looking through the OWiD original, I've added Finland and China as comparators, Finland up around 1% @1850, then drops to match UK:
ourworldindata.org/grapher/mate...

Les données concernant la mortalité Covid et les taux de vaccination proviennent de @OurWorldInData.La mortalité Covid est généralement présentée sous forme d'un taux hebdo = nb décès Covid / nb total de décès.
covid.ourworldindata.org/data/owid-covi…
covid.ourworldindata.org/data/owid-covi…
January 15, 2025 at 9:40 AM
Les données concernant la mortalité Covid et les taux de vaccination proviennent de @OurWorldInData.La mortalité Covid est généralement présentée sous forme d'un taux hebdo = nb décès Covid / nb total de décès.
covid.ourworldindata.org/data/owid-covi…
covid.ourworldindata.org/data/owid-covi…

You can find the data & code to recreate the chart here: github.com/owid/noteboo...

notebooks/SaloniDattani at main · owid/notebooks
Our World In Data jupyter notebooks. Contribute to owid/notebooks development by creating an account on GitHub.
github.com
July 31, 2024 at 6:40 PM
You can find the data & code to recreate the chart here: github.com/owid/noteboo...

Dat is wel echt een enorme industriele revolutie nietwaar Jaap? Die Simon van Teutem is dan ook wel een gave vent. Liet de duur betaalde consultancywereld achter zich om voor OWiD te gaan werken van Hannah Richie. Hoopvolle jeugd van tegenwoordig😉
August 6, 2025 at 8:41 PM
Dat is wel echt een enorme industriele revolutie nietwaar Jaap? Die Simon van Teutem is dan ook wel een gave vent. Liet de duur betaalde consultancywereld achter zich om voor OWiD te gaan werken van Hannah Richie. Hoopvolle jeugd van tegenwoordig😉

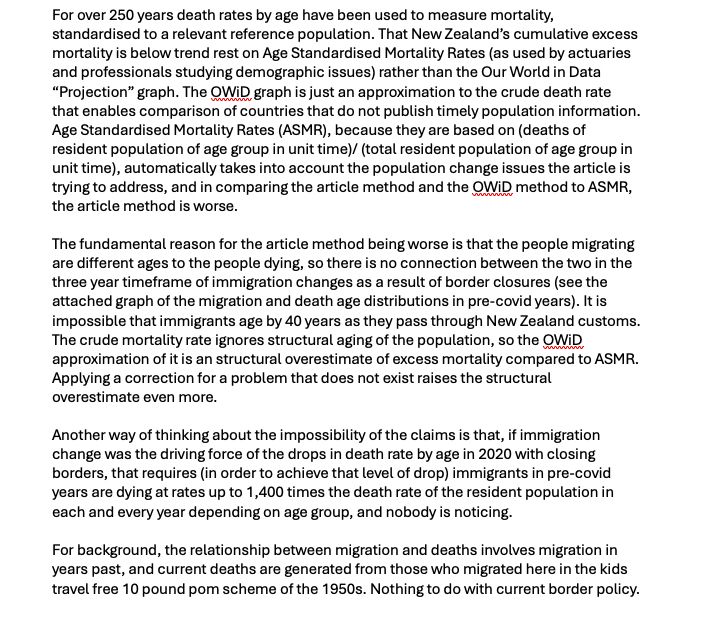
And here's a critique of the OWID methodology.
As far as I can tell, a bunch of things are true at once:
- Maternal mortality is under-reported, so any effort to improve measurement is going to make it look like the problem is getting worse.
x.com/drStuartGilm...
As far as I can tell, a bunch of things are true at once:
- Maternal mortality is under-reported, so any effort to improve measurement is going to make it look like the problem is getting worse.
x.com/drStuartGilm...
x.com
x.com
May 30, 2024 at 12:18 PM
And here's a critique of the OWID methodology.
As far as I can tell, a bunch of things are true at once:
- Maternal mortality is under-reported, so any effort to improve measurement is going to make it look like the problem is getting worse.
x.com/drStuartGilm...
As far as I can tell, a bunch of things are true at once:
- Maternal mortality is under-reported, so any effort to improve measurement is going to make it look like the problem is getting worse.
x.com/drStuartGilm...
The main bit of the letter in question.
February 25, 2024 at 1:39 AM
The main bit of the letter in question.

I episodically write to OWID about the iffiness of a few of their claims and never hear back. I don’t think they’re interested in data; only in their larger ideological project
March 11, 2025 at 1:14 PM
I episodically write to OWID about the iffiness of a few of their claims and never hear back. I don’t think they’re interested in data; only in their larger ideological project

I agree, it’s surprisingly high. The data appears to be from the Economist Intelligence Unit. OWID recommends other sources for different takes on democracy. Here it’s much lower.

December 6, 2025 at 5:38 PM
I agree, it’s surprisingly high. The data appears to be from the Economist Intelligence Unit. OWID recommends other sources for different takes on democracy. Here it’s much lower.

Thanks I would definitely agree more with that perspective
In general, important to keep in mind, there is tentatively already too much food eaten and wasted today.
E.g.check out OWID
Add to your calc that rich societies are ageing so calories intake decreases
ourworldindata.org/grapher/dail...
In general, important to keep in mind, there is tentatively already too much food eaten and wasted today.
E.g.check out OWID
Add to your calc that rich societies are ageing so calories intake decreases
ourworldindata.org/grapher/dail...

Daily per capita supply of calories vs. GDP per capita
Daily per capita supply of calories is measured in kilocalories per person per day. Gross domestic product (GDP) per capita is measured in constant international-$, which adjusts for inflation and cro...
ourworldindata.org
December 14, 2024 at 8:25 PM
Thanks I would definitely agree more with that perspective
In general, important to keep in mind, there is tentatively already too much food eaten and wasted today.
E.g.check out OWID
Add to your calc that rich societies are ageing so calories intake decreases
ourworldindata.org/grapher/dail...
In general, important to keep in mind, there is tentatively already too much food eaten and wasted today.
E.g.check out OWID
Add to your calc that rich societies are ageing so calories intake decreases
ourworldindata.org/grapher/dail...
Ollie: mum ses kud it b covid ? Des diffawent stwayns keep emewgin..... woteva dat owid bug dus b we tell it to do wun as well lottsa luffs n ugs sweetie 😘💖😍🥰🤗😘💖😍🥰🌟
October 15, 2025 at 8:44 PM
Ollie: mum ses kud it b covid ? Des diffawent stwayns keep emewgin..... woteva dat owid bug dus b we tell it to do wun as well lottsa luffs n ugs sweetie 😘💖😍🥰🤗😘💖😍🥰🌟

There seems to be something wrong with the data shown on OWID. On the page for electricity generation page they show 18.8 TWh for solar but on primary energy consumption page they show only 4.4 TWh for solar apparently after adjusting it upward with substitution method.
September 30, 2025 at 7:14 PM
There seems to be something wrong with the data shown on OWID. On the page for electricity generation page they show 18.8 TWh for solar but on primary energy consumption page they show only 4.4 TWh for solar apparently after adjusting it upward with substitution method.

OWID has lots of data on poverty in general, but I couldn’t find child poverty specifically (although I presume the trends would be very similar)
ourworldindata.org/grapher/tota...
ourworldindata.org/grapher/tota...

Total population living in extreme poverty by world region
Extreme poverty is defined as living below the International Poverty Line of $3 per day. This data is adjusted for inflation and differences in living costs between countries.
ourworldindata.org
December 2, 2025 at 5:33 PM
OWID has lots of data on poverty in general, but I couldn’t find child poverty specifically (although I presume the trends would be very similar)
ourworldindata.org/grapher/tota...
ourworldindata.org/grapher/tota...