


T. from Data Rocks
@datarocksnz.bsky.social
Dataviz | Information Design
The person behind The Dataviz Bookshelf, The Data Design Manifesto & The Design Matters newsletter series.
I don't use autocorrect. I own all of my typos.
https://www.datarocks.co.nz
The person behind The Dataviz Bookshelf, The Data Design Manifesto & The Design Matters newsletter series.
I don't use autocorrect. I own all of my typos.
https://www.datarocks.co.nz
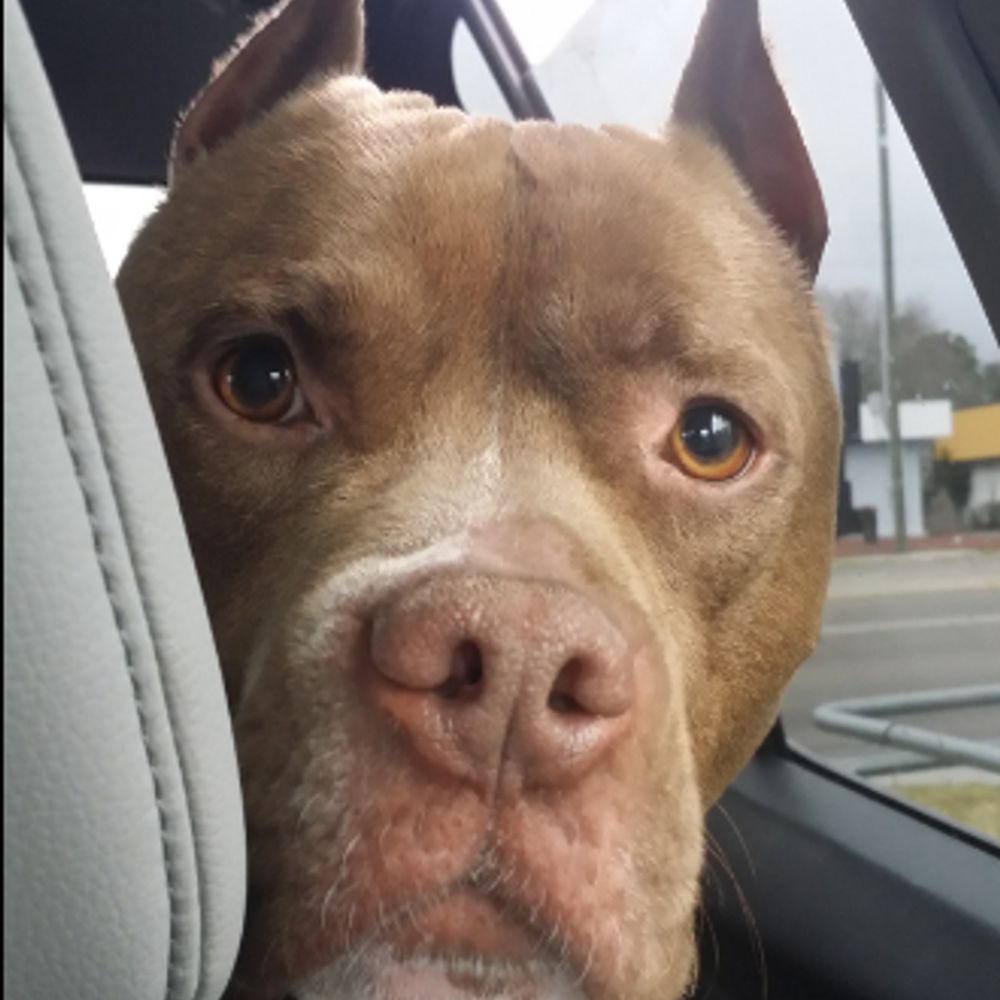
If Data Rocks NZ was a band, this would be the album cover.

February 7, 2026 at 8:32 PM
If Data Rocks NZ was a band, this would be the album cover.
Reposted by T. from Data Rocks


Reposted by T. from Data Rocks

We’re clearing out our warehouse inventory and everything must go! Get 20% OFF all print issues of Nightingale through February 14.
⚠️ Important: We do not plan on reprinting these issues. Once they’re gone, they are gone for good.
🎟️ Code: SAVE20 🛒 Shop here: shop.datavisualizationsociety.org
⚠️ Important: We do not plan on reprinting these issues. Once they’re gone, they are gone for good.
🎟️ Code: SAVE20 🛒 Shop here: shop.datavisualizationsociety.org

February 2, 2026 at 6:58 PM
We’re clearing out our warehouse inventory and everything must go! Get 20% OFF all print issues of Nightingale through February 14.
⚠️ Important: We do not plan on reprinting these issues. Once they’re gone, they are gone for good.
🎟️ Code: SAVE20 🛒 Shop here: shop.datavisualizationsociety.org
⚠️ Important: We do not plan on reprinting these issues. Once they’re gone, they are gone for good.
🎟️ Code: SAVE20 🛒 Shop here: shop.datavisualizationsociety.org
Reposted by T. from Data Rocks

In case you missed it yesterday...
The Open Visualization Academy (OVA) IS LIVE!
openvisualizationacademy.org
Thread follows #dataViz #infographics #dataJournalism #dataVisualization
openvisualizationacademy.org
Thread follows #dataViz #infographics #dataJournalism #dataVisualization

January 31, 2026 at 3:58 PM
In case you missed it yesterday...
Reposted by T. from Data Rocks
The Open Visualization Academy (OVA) IS LIVE!
openvisualizationacademy.org
Thread follows #dataViz #infographics #dataJournalism #dataVisualization
openvisualizationacademy.org
Thread follows #dataViz #infographics #dataJournalism #dataVisualization
January 30, 2026 at 3:09 PM
The Open Visualization Academy (OVA) IS LIVE!
openvisualizationacademy.org
Thread follows #dataViz #infographics #dataJournalism #dataVisualization
openvisualizationacademy.org
Thread follows #dataViz #infographics #dataJournalism #dataVisualization
Reposted by T. from Data Rocks
The Open Visualization Academy launches TOMORROW MORNING (EST) openvisualizationacademy.org with 7 courses; we'll release 1-2 more/month beginning in February.
Sneak peek at our website, designed by @vsueiro.bsky.social and Melissa Strong #dataViz #dataVisualization #infographics #dataJournalism
Sneak peek at our website, designed by @vsueiro.bsky.social and Melissa Strong #dataViz #dataVisualization #infographics #dataJournalism
January 29, 2026 at 6:30 PM
The Open Visualization Academy launches TOMORROW MORNING (EST) openvisualizationacademy.org with 7 courses; we'll release 1-2 more/month beginning in February.
Sneak peek at our website, designed by @vsueiro.bsky.social and Melissa Strong #dataViz #dataVisualization #infographics #dataJournalism
Sneak peek at our website, designed by @vsueiro.bsky.social and Melissa Strong #dataViz #dataVisualization #infographics #dataJournalism
This is a great initiative to practice building dashboards and a portfolio!
Tagging the #dataviz field, so folks get to see it there too!
:)
Tagging the #dataviz field, so folks get to see it there too!
:)

Did you know Real World Fake Data is back? Has been for a while, but it's so hard to reach people nowadays... anyway, if you want to build your Tableau Public portfolio with some buisness dashboards this is a great way to do it! go to sonsofhierarchies.com to find information #RWFD #Tableau #Datafam
Sons of Hierarchies
sonsofhierarchies.com
January 29, 2026 at 6:51 AM
This is a great initiative to practice building dashboards and a portfolio!
Tagging the #dataviz field, so folks get to see it there too!
:)
Tagging the #dataviz field, so folks get to see it there too!
:)
Reposted by T. from Data Rocks

If Bilbo had Chat GPT

January 27, 2026 at 4:24 PM
If Bilbo had Chat GPT
This will be awesome!
I honestly can't wait!
Many moons ago, it was one of Alberto's MOOCs that got me out of a depressive slump and into a career I genuinely love.
I must say this is timely again, and I am sure many more people will sing the impacts of this initiative for years to come.
📊
I honestly can't wait!
Many moons ago, it was one of Alberto's MOOCs that got me out of a depressive slump and into a career I genuinely love.
I must say this is timely again, and I am sure many more people will sing the impacts of this initiative for years to come.
📊
The Open Visualization Academy launches on FRIDAY! openvisualizationacademy.org
More information in our newsletter: openvisualizationacademy.beehiiv.com/p/the-open-v...
#dataViz #dataVisualization #infographics #dataJournalism
More information in our newsletter: openvisualizationacademy.beehiiv.com/p/the-open-v...
#dataViz #dataVisualization #infographics #dataJournalism

January 27, 2026 at 7:24 PM
This will be awesome!
I honestly can't wait!
Many moons ago, it was one of Alberto's MOOCs that got me out of a depressive slump and into a career I genuinely love.
I must say this is timely again, and I am sure many more people will sing the impacts of this initiative for years to come.
📊
I honestly can't wait!
Many moons ago, it was one of Alberto's MOOCs that got me out of a depressive slump and into a career I genuinely love.
I must say this is timely again, and I am sure many more people will sing the impacts of this initiative for years to come.
📊
Reposted by T. from Data Rocks
🎉 We’ve received 709 responses to the 2025 SOTI Survey so far! Take the survey if you create #dataviz in any capacity (hobby, work, school, art), and help us spread the word: www.surveyhero.com/c/soti2025-b...

January 26, 2026 at 2:53 PM
🎉 We’ve received 709 responses to the 2025 SOTI Survey so far! Take the survey if you create #dataviz in any capacity (hobby, work, school, art), and help us spread the word: www.surveyhero.com/c/soti2025-b...
The most adorable thing you'll see!

If anyone wants to see a livestream of a #kakapo on their nest, then Rakiura is back on her nest NOW. #kakapo2026 #conservation
www.youtube.com/live/BfGL7A2...
www.youtube.com/live/BfGL7A2...

Kākāpō Cam: Rakiura the kākāpō – 2026 nest
YouTube video by Department of Conservation
www.youtube.com
January 23, 2026 at 5:40 PM
The most adorable thing you'll see!
Reposted by T. from Data Rocks
"It’s been a busy and stressful year, but it’s been worth it, as nothing I’ve done before —my four books, public talks, the popular MOOCs in the early-to-mid 2010’s— compares in scope and ambition to the Open Visualization Academy."
- @albertocairo.com
- @albertocairo.com

The Open Visualization Academy is almost here
We launch next week; save the date!
openvisualizationacademy.beehiiv.com
January 22, 2026 at 10:04 PM
"It’s been a busy and stressful year, but it’s been worth it, as nothing I’ve done before —my four books, public talks, the popular MOOCs in the early-to-mid 2010’s— compares in scope and ambition to the Open Visualization Academy."
- @albertocairo.com
- @albertocairo.com
Reposted by T. from Data Rocks
In the newsletter: The Open Visualization Academy is almost here. We launch next week; save the date! openvisualizationacademy.beehiiv.com/p/the-open-v...
#dataViz #infographics #dataJournalism
#dataViz #infographics #dataJournalism

The Open Visualization Academy is almost here
We launch next week; save the date!
openvisualizationacademy.beehiiv.com
January 22, 2026 at 1:48 PM
In the newsletter: The Open Visualization Academy is almost here. We launch next week; save the date! openvisualizationacademy.beehiiv.com/p/the-open-v...
#dataViz #infographics #dataJournalism
#dataViz #infographics #dataJournalism
Reposted by T. from Data Rocks

NEW POST: Last week I had a lovely chat with @georginasturge.bsky.social for an episode of her 'Talk Data To Me' podcast where we discussed all sorts of different matters to do with data viz: past, present and future.
visualisingdata.com/2026/01/appe...
visualisingdata.com/2026/01/appe...

Appearance on the Talk Data To Me Podcast - Data Viz Excellence, Everywhere
Last month I had the pleasure of being invited on to The Chris Gill Podcast, a great series where Chris chats with people working within professional sport from around the world. I was there to talk a...
visualisingdata.com
January 16, 2026 at 12:40 PM
NEW POST: Last week I had a lovely chat with @georginasturge.bsky.social for an episode of her 'Talk Data To Me' podcast where we discussed all sorts of different matters to do with data viz: past, present and future.
visualisingdata.com/2026/01/appe...
visualisingdata.com/2026/01/appe...
Reposted by T. from Data Rocks

In an ongoing war against misinformation; AI hallucinations; the ranking of information being determined by advertising revenue; SEO slop; and the general enshitification of the web in general and search in particular, #Wikipedia is leading the charge. It's well worth celebrating this milestone.
Good News in History, January 15: 25 years ago today, Jimmy Wales and Larry Sanger launched Wikipedia. The collaborative online encyclopedia created and maintained by a community of volunteer editors, Wikipedia is… @goodnewsnetwork.org #Wikipedia #GoodNews #History #Anniversaries #OnlineEncyclopedia

Good News in History, January 15
25 years ago today, Jimmy Wales and Larry Sanger launched Wikipedia. The collaborative online encyclopedia created and maintained by a community of volunteer editors, Wikipedia is one of the most-visited websites on the internet. The nonprofit funded primarily through donations has 6.2 million articles in English—and also features articles in 250 languages, altogether attracting 1.7 […]
The post Good News in History, January 15 appeared first on Good News Network.
dlvr.it
January 15, 2026 at 9:30 AM
In an ongoing war against misinformation; AI hallucinations; the ranking of information being determined by advertising revenue; SEO slop; and the general enshitification of the web in general and search in particular, #Wikipedia is leading the charge. It's well worth celebrating this milestone.
Reposted by T. from Data Rocks

Life is meaningless if you can't make charts like this.

January 14, 2026 at 9:46 AM
Life is meaningless if you can't make charts like this.
Reposted by T. from Data Rocks
The DVS Mentorship Program returns! Apply by January 30 for the Feb - Apr cohort. This program offers mentees early in their #dataviz career an opportunity to work with a mentor who has 5+ years of professional experience in the field.
Apply here: www.datavisualizationsociety.org/mentorship
Apply here: www.datavisualizationsociety.org/mentorship

January 13, 2026 at 7:30 PM
The DVS Mentorship Program returns! Apply by January 30 for the Feb - Apr cohort. This program offers mentees early in their #dataviz career an opportunity to work with a mentor who has 5+ years of professional experience in the field.
Apply here: www.datavisualizationsociety.org/mentorship
Apply here: www.datavisualizationsociety.org/mentorship
Tagging the #dataviz feed
This looks interesting!
This looks interesting!
I'm working with some stellar collaborators to bring this data set to life through a data visualization contest. Please consider participating. Just *looking* at the data will expand its reach.
bigpic.me/broadway
bigpic.me/broadway

Women+ Conductors on Broadway Data Visualization Contest
Broadway has a rich history of music and artistry, but until recently, little attention has been given to the representation of female and nonbinary conductors, music directors, and music supervisors ...
bigpic.me
January 12, 2026 at 4:38 PM
Tagging the #dataviz feed
This looks interesting!
This looks interesting!
Reposted by T. from Data Rocks

I'm working with some stellar collaborators to bring this data set to life through a data visualization contest. Please consider participating. Just *looking* at the data will expand its reach.
bigpic.me/broadway
bigpic.me/broadway
Women+ Conductors on Broadway Data Visualization Contest
Broadway has a rich history of music and artistry, but until recently, little attention has been given to the representation of female and nonbinary conductors, music directors, and music supervisors ...
bigpic.me
January 12, 2026 at 4:15 PM
I'm working with some stellar collaborators to bring this data set to life through a data visualization contest. Please consider participating. Just *looking* at the data will expand its reach.
bigpic.me/broadway
bigpic.me/broadway
Reposted by T. from Data Rocks


It's amazing how much early platforms have trained us to believe that "like" = "this is worth more and therefore should be amplified". This ties value to engagement, which is the point is ad-supported spaces. But Bluesky has no ads or algo, unless the feed does otherwise. So, repost, repost, repost!

I feel like a good thing Bluesky peeps still don't get is that the reskeet is *everything*.
On twitter a like meant that content would be slightly amplified by the algorithm.
Here you need to actively share stuff that you appreciate.
On twitter a like meant that content would be slightly amplified by the algorithm.
Here you need to actively share stuff that you appreciate.
January 11, 2026 at 9:19 PM
It's amazing how much early platforms have trained us to believe that "like" = "this is worth more and therefore should be amplified". This ties value to engagement, which is the point is ad-supported spaces. But Bluesky has no ads or algo, unless the feed does otherwise. So, repost, repost, repost!
Reposted by T. from Data Rocks

#dataviz educators, what are some things you could use from the R/Python ecosystem of packages but in the browser for no-code teaching? Last year I made Pivotteer to provide a GUI for dplyr's pivot functions (unparalleled API), what else would be nice to have?
pivotteer.netlify.app
pivotteer.netlify.app

Pivotteer
Transform data between wide and long formats
pivotteer.netlify.app
January 11, 2026 at 4:35 PM
#dataviz educators, what are some things you could use from the R/Python ecosystem of packages but in the browser for no-code teaching? Last year I made Pivotteer to provide a GUI for dplyr's pivot functions (unparalleled API), what else would be nice to have?
pivotteer.netlify.app
pivotteer.netlify.app
Reading Paulina Borsook's Cyberselfish for the first time and...
Wow. Go read it, everyone.
You can find it in the Internet Archive library.
Wow. Go read it, everyone.
You can find it in the Internet Archive library.
January 11, 2026 at 2:10 AM
Reading Paulina Borsook's Cyberselfish for the first time and...
Wow. Go read it, everyone.
You can find it in the Internet Archive library.
Wow. Go read it, everyone.
You can find it in the Internet Archive library.
Reposted by T. from Data Rocks

Sometimes you just have to let @lopatto.bsky.social say it out loud www.theverge.com/policy/85990...

Tim Cook and Sundar Pichai are cowards
Once you’ve traded your principles for proximity to power, do you even run your own company?
www.theverge.com
January 9, 2026 at 9:29 PM
Sometimes you just have to let @lopatto.bsky.social say it out loud www.theverge.com/policy/85990...
Reposted by T. from Data Rocks
Just a note in passing regarding the Bluesky dataviz community: this post has lots of activity here in 24 hours and also, Joey did not announce it on X. It happens here. 🦋📊

January 8, 2026 at 8:42 PM
Just a note in passing regarding the Bluesky dataviz community: this post has lots of activity here in 24 hours and also, Joey did not announce it on X. It happens here. 🦋📊