


Ian Plummer
@iplumm.bsky.social
PhD student at SUNY Albany, reconstructing Red Sea paleoclimate with corals! Either in the lab, coding, or playing pokemon. LGI 🏝️ LGM 🍎
Troy, NY
He/Him
https://plummquat.github.io/IanPlummer/
Troy, NY
He/Him
https://plummquat.github.io/IanPlummer/
Pinned
Ian Plummer
@iplumm.bsky.social
· Oct 13
Client Challenge
link.springer.com
My first main authored paper is out today! 🧪🔬
We explore the role that distant ENSO teleconnections to the North Atlantic have in interrupting the dynamics that link the NAO to winter SST variability in the Red Sea.
Spoiler: they play a huge role!
link.springer.com/article/10.1...
#climate
We explore the role that distant ENSO teleconnections to the North Atlantic have in interrupting the dynamics that link the NAO to winter SST variability in the Red Sea.
Spoiler: they play a huge role!
link.springer.com/article/10.1...
#climate
Reposted by Ian Plummer
Excited for this paper to be out! With the collaboration of met services from Central America, we evaluate in detail the biases in gridded products that arise from the underlying station data, and the effect this has on the apparent emergence of regional drying trends. Thanks to all the co-authors!
Rainfall data can be hard to come by in the tropics. @anaigmendez.bsky.social leads a new paper taking a deep dive into the quality and potential biases in gridded precipitation data in Central America. CHIRPS comes out ahead, but be wary of trends! agupubs.onlinelibrary.wiley.com/doi/10.1029/...

Impacts of Spatial and Temporal Station Availability on Gridded Precipitation Products in Central America
There are significant differences between gridded precipitation products in Central America in both variability and trends CHIRPS consistently outperforms Global Precipitation Climatology Centre ...
agupubs.onlinelibrary.wiley.com
December 10, 2025 at 5:44 PM
Excited for this paper to be out! With the collaboration of met services from Central America, we evaluate in detail the biases in gridded products that arise from the underlying station data, and the effect this has on the apparent emergence of regional drying trends. Thanks to all the co-authors!
November in NY was average to slightly cooler than average (albeit warmer than the avg Nov pre 1980) and drier than average outside of the lake impacted regions in Central NY and the ADKs.


December 10, 2025 at 4:20 PM
November in NY was average to slightly cooler than average (albeit warmer than the avg Nov pre 1980) and drier than average outside of the lake impacted regions in Central NY and the ADKs.
Reposted by Ian Plummer

🏆 CHAMPIONS AGAIN 🏆
GOTHAM FC are the 2025 NWSL Champions! 💙🖤
A clutch finish from Rose Lavelle sealed the 1–0 win and the crown. A night written into club history.
YOUR 2025 CHAMPIONS. ✨
GOTHAM FC are the 2025 NWSL Champions! 💙🖤
A clutch finish from Rose Lavelle sealed the 1–0 win and the crown. A night written into club history.
YOUR 2025 CHAMPIONS. ✨

November 23, 2025 at 3:18 AM
🏆 CHAMPIONS AGAIN 🏆
GOTHAM FC are the 2025 NWSL Champions! 💙🖤
A clutch finish from Rose Lavelle sealed the 1–0 win and the crown. A night written into club history.
YOUR 2025 CHAMPIONS. ✨
GOTHAM FC are the 2025 NWSL Champions! 💙🖤
A clutch finish from Rose Lavelle sealed the 1–0 win and the crown. A night written into club history.
YOUR 2025 CHAMPIONS. ✨
Hockey Fights Cancer Night at UBS


November 22, 2025 at 10:10 PM
Hockey Fights Cancer Night at UBS
Reposted by Ian Plummer
1,019 glaciers have disappeared since 1973 in Switzerland! ✝️
1st nationwide assessment of vanished glaciers:
>40% of the glaciers inventoried in 1973
~13% (47±3 km²) of total glacier area loss! 🧊🔥
But, as it is based on the latest inventory (from 2016), the actual figures are far much higher! 📈 😰
1st nationwide assessment of vanished glaciers:
>40% of the glaciers inventoried in 1973
~13% (47±3 km²) of total glacier area loss! 🧊🔥
But, as it is based on the latest inventory (from 2016), the actual figures are far much higher! 📈 😰

November 19, 2025 at 12:05 PM
1,019 glaciers have disappeared since 1973 in Switzerland! ✝️
1st nationwide assessment of vanished glaciers:
>40% of the glaciers inventoried in 1973
~13% (47±3 km²) of total glacier area loss! 🧊🔥
But, as it is based on the latest inventory (from 2016), the actual figures are far much higher! 📈 😰
1st nationwide assessment of vanished glaciers:
>40% of the glaciers inventoried in 1973
~13% (47±3 km²) of total glacier area loss! 🧊🔥
But, as it is based on the latest inventory (from 2016), the actual figures are far much higher! 📈 😰
Reposted by Ian Plummer

The road leads straight to the NWSL Championship
Presented by Google Pixel
Presented by Google Pixel

November 16, 2025 at 10:23 PM
The road leads straight to the NWSL Championship
Presented by Google Pixel
Presented by Google Pixel
Reposted by Ian Plummer
JAEDYN SHAW IS THE DEFINITION OF CLUTCH!
November 16, 2025 at 10:16 PM
JAEDYN SHAW IS THE DEFINITION OF CLUTCH!
Reposted by Ian Plummer
Exciting news! Student applications for paleoCAMP 2026 are open! Are you a graduate student working on any aspect of past climates or environments? Apply to be part of our 2-week summer school in the eastern Sierra Nevada! More details here: paleoclimate.camp/apply

Application — paleoCAMP
paleoclimate.camp
November 13, 2025 at 2:41 PM
Exciting news! Student applications for paleoCAMP 2026 are open! Are you a graduate student working on any aspect of past climates or environments? Apply to be part of our 2-week summer school in the eastern Sierra Nevada! More details here: paleoclimate.camp/apply
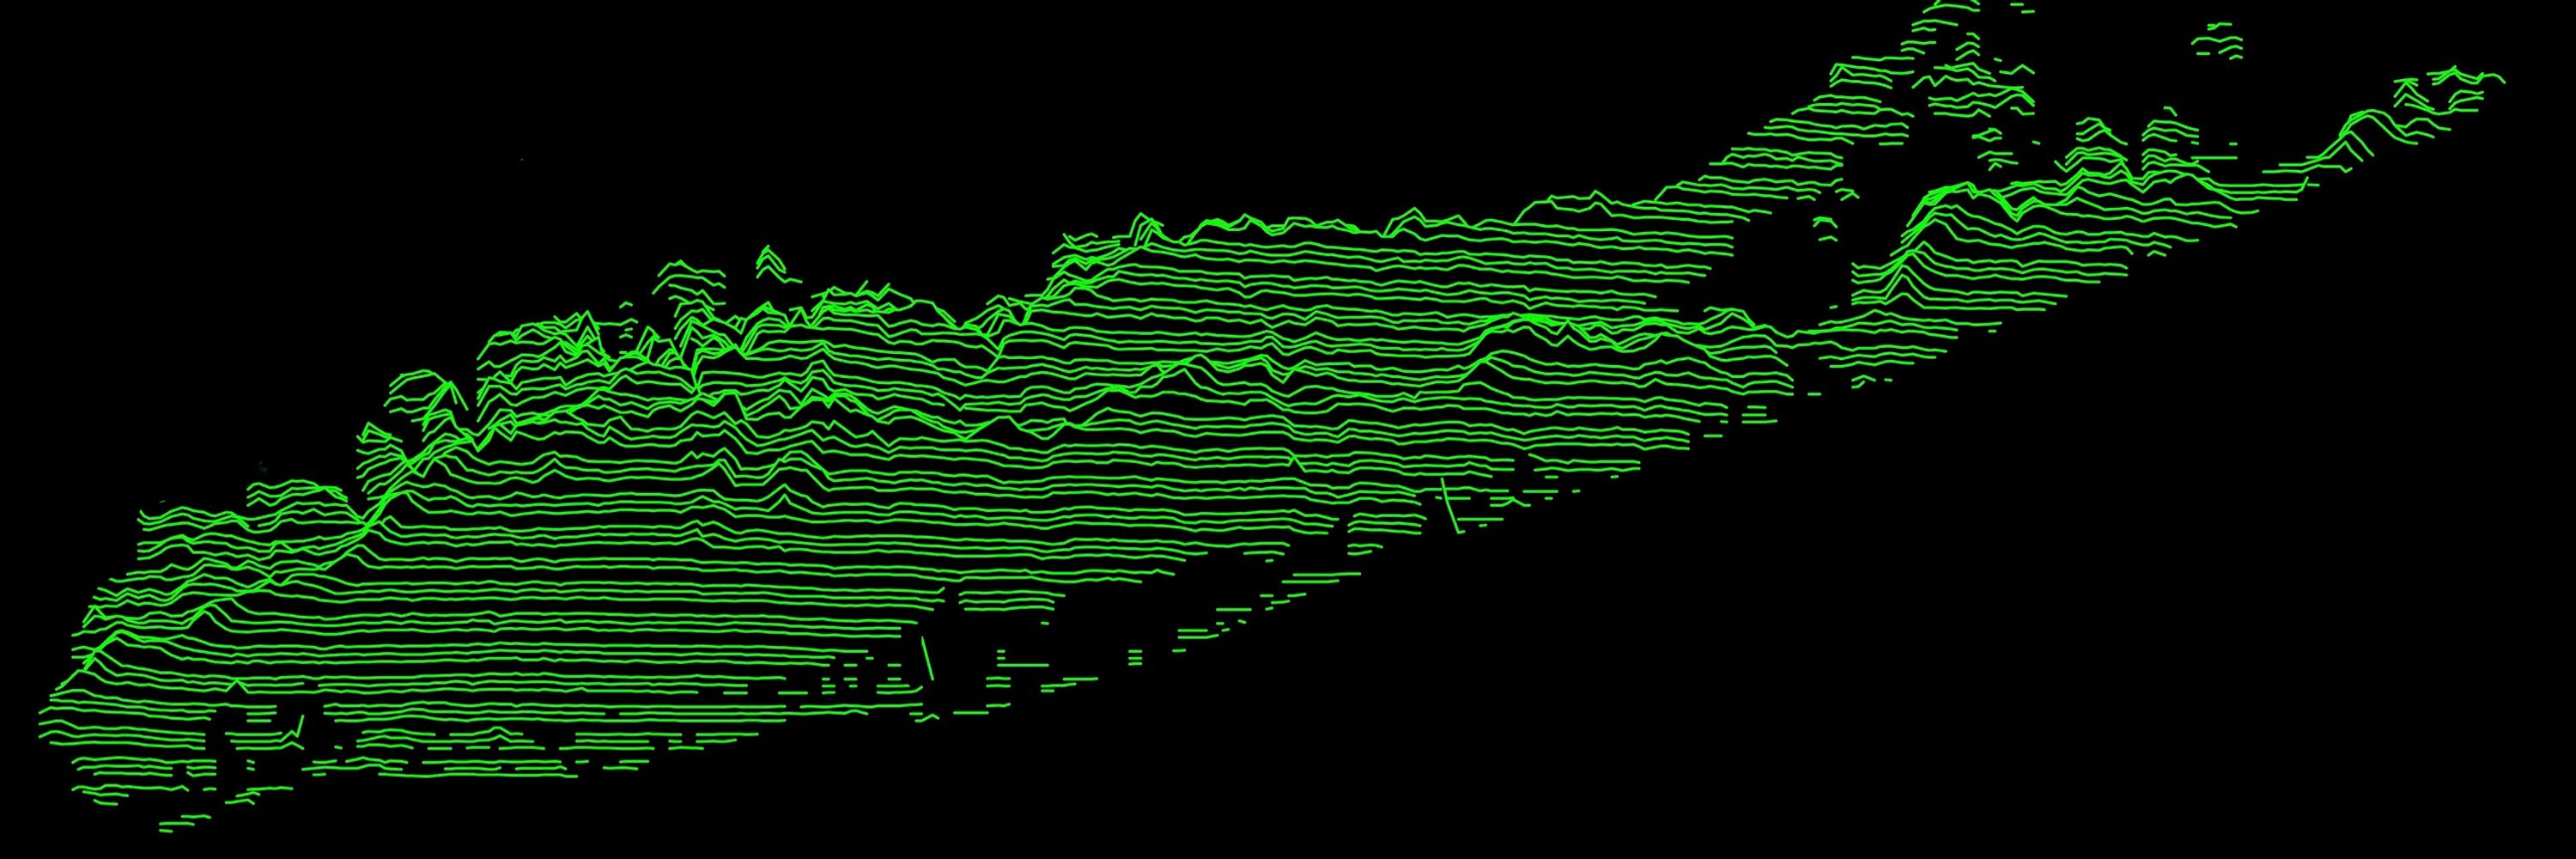
Faint Aurora Borealis over the Hudson River in Troy just now


November 12, 2025 at 3:07 AM
Faint Aurora Borealis over the Hudson River in Troy just now
Reposted by Ian Plummer
Fully funded PhD projects available in my group (Please share with interested parties, details here: www.thefosterlab.org/blog/2025/11...):
PhD Topics - Entry September 2026 — The Foster Lab
This year we are involved in 3 fully funded PhD projects via IGNITE our NERC DLA. The deadline is Thursday Jan 8th 2026 . 1. Is the world already 1.5 C warmer?...
www.thefosterlab.org
November 11, 2025 at 1:46 PM
Fully funded PhD projects available in my group (Please share with interested parties, details here: www.thefosterlab.org/blog/2025/11...):
Reposted by Ian Plummer

Video shows lava shot over 1,000 feet into the air from Hawaii's Kilauea volcano on Sunday. The impressive eruption was accompanied by a "volnado," or a tornado-like swirl of dust and ash caused by the contrast between the heated air near the lava and the cooler ambient air.
November 11, 2025 at 11:00 AM
Video shows lava shot over 1,000 feet into the air from Hawaii's Kilauea volcano on Sunday. The impressive eruption was accompanied by a "volnado," or a tornado-like swirl of dust and ash caused by the contrast between the heated air near the lava and the cooler ambient air.
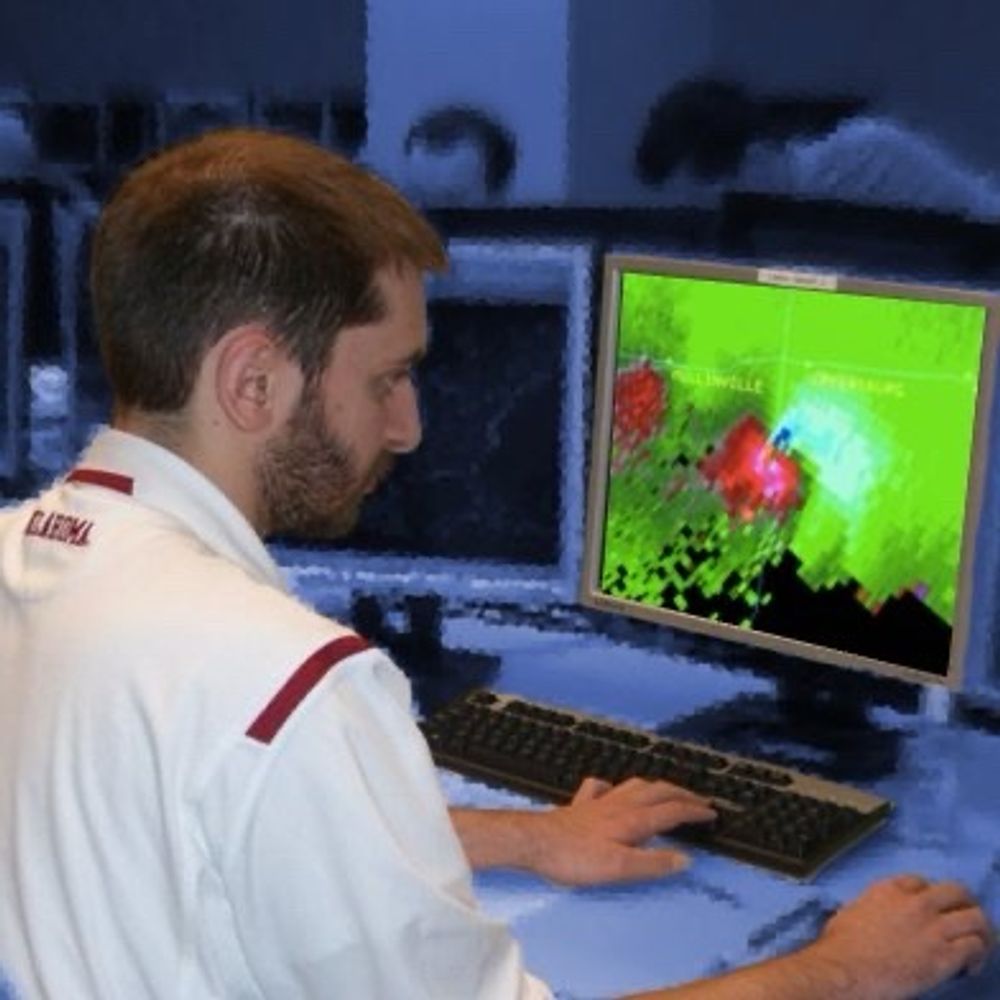
In light of the 50th anniversary of the Wreck of the Edmund Fitzgerald, here is one of the cooler model case studies published.
journals.ametsoc.org/view/journal...
images from here since the orgininal resolution is low www.weather.gov/mqt/fitz_res...
journals.ametsoc.org/view/journal...
images from here since the orgininal resolution is low www.weather.gov/mqt/fitz_res...


November 10, 2025 at 3:19 PM
In light of the 50th anniversary of the Wreck of the Edmund Fitzgerald, here is one of the cooler model case studies published.
journals.ametsoc.org/view/journal...
images from here since the orgininal resolution is low www.weather.gov/mqt/fitz_res...
journals.ametsoc.org/view/journal...
images from here since the orgininal resolution is low www.weather.gov/mqt/fitz_res...
Reposted by Ian Plummer
Gotham FC with the upset extra time win in KC to advance to the semis!

November 9, 2025 at 8:34 PM
Gotham FC with the upset extra time win in KC to advance to the semis!
Reposted by Ian Plummer
i wanted a golden goal walk-off banger AND I GOT ONE
November 9, 2025 at 8:31 PM
i wanted a golden goal walk-off banger AND I GOT ONE
Reposted by Ian Plummer

Reposted by Ian Plummer

Exposure to thermal stress – whether from extreme heat or cold – poses risks to our health. The Thermal Trace app from #C3S helps everyone stay informed. Just select a date and location on the map, choose a variable & visualise or even download charts & data.
⬇️
⬇️
November 3, 2025 at 1:12 PM
Exposure to thermal stress – whether from extreme heat or cold – poses risks to our health. The Thermal Trace app from #C3S helps everyone stay informed. Just select a date and location on the map, choose a variable & visualise or even download charts & data.
⬇️
⬇️
Reposted by Ian Plummer

A damaging hurricane in a warmer world
How would a major hurricane that hit Jamaica in 1903 be different today, in a warmer world?
It would drop more rain. (At least)
climatelabbook.substack.com/p/a-damaging...
How would a major hurricane that hit Jamaica in 1903 be different today, in a warmer world?
It would drop more rain. (At least)
climatelabbook.substack.com/p/a-damaging...

November 2, 2025 at 9:21 AM
A damaging hurricane in a warmer world
How would a major hurricane that hit Jamaica in 1903 be different today, in a warmer world?
It would drop more rain. (At least)
climatelabbook.substack.com/p/a-damaging...
How would a major hurricane that hit Jamaica in 1903 be different today, in a warmer world?
It would drop more rain. (At least)
climatelabbook.substack.com/p/a-damaging...
And so unto us, the word of the Lord "Go Bills"

This is a real: Pope Leo XIV was gifted a Buffalo Bills jersey.
The Diocese of Buffalo said Bishop Fisher met with the Pope on Monday to discuss the ongoing bankruptcy filing, among other issues.
Pope Leo was said to have "expressed his gratitude for this symbol of hometown pride." #billsmafia
The Diocese of Buffalo said Bishop Fisher met with the Pope on Monday to discuss the ongoing bankruptcy filing, among other issues.
Pope Leo was said to have "expressed his gratitude for this symbol of hometown pride." #billsmafia

October 30, 2025 at 6:07 PM
And so unto us, the word of the Lord "Go Bills"


Reposted by Ian Plummer
My first main authored paper is out today! 🧪🔬
We explore the role that distant ENSO teleconnections to the North Atlantic have in interrupting the dynamics that link the NAO to winter SST variability in the Red Sea.
Spoiler: they play a huge role!
link.springer.com/article/10.1...
#climate
We explore the role that distant ENSO teleconnections to the North Atlantic have in interrupting the dynamics that link the NAO to winter SST variability in the Red Sea.
Spoiler: they play a huge role!
link.springer.com/article/10.1...
#climate
Client Challenge
link.springer.com
October 13, 2025 at 8:22 PM
My first main authored paper is out today! 🧪🔬
We explore the role that distant ENSO teleconnections to the North Atlantic have in interrupting the dynamics that link the NAO to winter SST variability in the Red Sea.
Spoiler: they play a huge role!
link.springer.com/article/10.1...
#climate
We explore the role that distant ENSO teleconnections to the North Atlantic have in interrupting the dynamics that link the NAO to winter SST variability in the Red Sea.
Spoiler: they play a huge role!
link.springer.com/article/10.1...
#climate
Reposted by Ian Plummer

NASA's Jet Propulsion Laboratory to lay off about 550 workers reut.rs/4302N2L

NASA's Jet Propulsion Laboratory to lay off about 550 workers
NASA's Jet Propulsion Laboratory said on Monday it will cut nearly 550 jobs as part of a restructuring, not related to the current U.S. government shutdown.
reut.rs
October 13, 2025 at 7:50 PM
NASA's Jet Propulsion Laboratory to lay off about 550 workers reut.rs/4302N2L
My first main authored paper is out today! 🧪🔬
We explore the role that distant ENSO teleconnections to the North Atlantic have in interrupting the dynamics that link the NAO to winter SST variability in the Red Sea.
Spoiler: they play a huge role!
link.springer.com/article/10.1...
#climate
We explore the role that distant ENSO teleconnections to the North Atlantic have in interrupting the dynamics that link the NAO to winter SST variability in the Red Sea.
Spoiler: they play a huge role!
link.springer.com/article/10.1...
#climate
Client Challenge
link.springer.com
October 13, 2025 at 8:22 PM
My first main authored paper is out today! 🧪🔬
We explore the role that distant ENSO teleconnections to the North Atlantic have in interrupting the dynamics that link the NAO to winter SST variability in the Red Sea.
Spoiler: they play a huge role!
link.springer.com/article/10.1...
#climate
We explore the role that distant ENSO teleconnections to the North Atlantic have in interrupting the dynamics that link the NAO to winter SST variability in the Red Sea.
Spoiler: they play a huge role!
link.springer.com/article/10.1...
#climate
Reposted by Ian Plummer
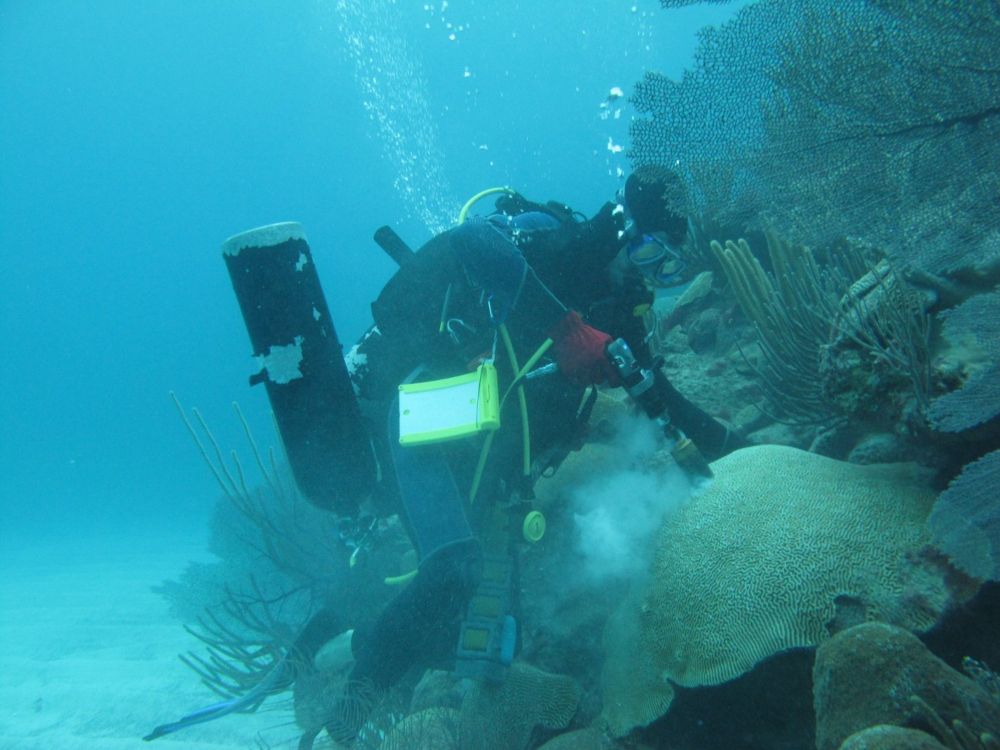
This is cool - new paper from Hali Kilbourne et al. 'Dating a Medieval Tsunami With Uranium-Series Techniques on Caribbean Corals' agupubs.onlinelibrary.wiley.com/doi/10.1029/...

Dating a Medieval Tsunami With Uranium‐Series Techniques on Caribbean Corals
Uranium-series analyses provide dates for 15 annually banded coral skeletons on the low Caribbean island of Anegada
A subset of the corals was likely washed ashore in a Puerto Rico Trench tsunami...
agupubs.onlinelibrary.wiley.com
October 8, 2025 at 5:55 PM
This is cool - new paper from Hali Kilbourne et al. 'Dating a Medieval Tsunami With Uranium-Series Techniques on Caribbean Corals' agupubs.onlinelibrary.wiley.com/doi/10.1029/...
Reposted by Ian Plummer

Just since 1970, 📍Albany, NY has warmed by 4.3°F.
There is a clear way of knowing that this is human-caused climate change.
@slapointewx.bsky.social walks you through the data 🔽
#ClimateMatters
youtu.be/EofLTRuKU8o?...
There is a clear way of knowing that this is human-caused climate change.
@slapointewx.bsky.social walks you through the data 🔽
#ClimateMatters
youtu.be/EofLTRuKU8o?...

CBS6 Earth Day Weather Report
YouTube video by CBS6 Albany
youtu.be
September 26, 2025 at 6:50 PM
Just since 1970, 📍Albany, NY has warmed by 4.3°F.
There is a clear way of knowing that this is human-caused climate change.
@slapointewx.bsky.social walks you through the data 🔽
#ClimateMatters
youtu.be/EofLTRuKU8o?...
There is a clear way of knowing that this is human-caused climate change.
@slapointewx.bsky.social walks you through the data 🔽
#ClimateMatters
youtu.be/EofLTRuKU8o?...
Reposted by Ian Plummer
Weather Prediction Center (WPC) has unveiled the experimental Urban Rain Rate Dashboard. It uses high-res model guidance to highlight where chances of intense rain rates are highest in major cities. It’s linked in “Forecast Tools” tab on the WPC home page. Direct link: www.wpc.ncep.noaa.gov/urrd/

September 26, 2025 at 4:47 PM
Weather Prediction Center (WPC) has unveiled the experimental Urban Rain Rate Dashboard. It uses high-res model guidance to highlight where chances of intense rain rates are highest in major cities. It’s linked in “Forecast Tools” tab on the WPC home page. Direct link: www.wpc.ncep.noaa.gov/urrd/