

Clare Griffiths
@statsgeekclare.bsky.social
Demographer, former tweeting statistician and female data lad. Attempting to make a difference in public health analysis at DHSC. I ran the UK's covid dashboard. Now seen running parkruns. DMs not available. She/her 🍉🏳️⚧️🏳️🌈
Reposted by Clare Griffiths

One of the biggest challenges in public health & environment-related fields is the miscommunication of population-scale results to the individual-level
This is often caused by the desire to formulate “action” relevant to people’s lives but ends up blaming individuals for things not in their control
This is often caused by the desire to formulate “action” relevant to people’s lives but ends up blaming individuals for things not in their control
November 25, 2025 at 9:10 AM
One of the biggest challenges in public health & environment-related fields is the miscommunication of population-scale results to the individual-level
This is often caused by the desire to formulate “action” relevant to people’s lives but ends up blaming individuals for things not in their control
This is often caused by the desire to formulate “action” relevant to people’s lives but ends up blaming individuals for things not in their control
Reposted by Clare Griffiths

Looks like I am going to have to repost this until someone takes action - anyone want to commission me to write about [email protected] @simeonkerr.bsky.social @heraldscotland.bsky.social @scotnational.bsky.social
digitalpolicy.substack.com/p/how-the-go...
digitalpolicy.substack.com/p/how-the-go...

How the government should leave Twitter
by not leaving twitter
digitalpolicy.substack.com
November 21, 2025 at 9:57 AM
Looks like I am going to have to repost this until someone takes action - anyone want to commission me to write about [email protected] @simeonkerr.bsky.social @heraldscotland.bsky.social @scotnational.bsky.social
digitalpolicy.substack.com/p/how-the-go...
digitalpolicy.substack.com/p/how-the-go...
Reposted by Clare Griffiths

We are in the process of creating a new journal for our community, the Population Health Journal, and we are now inviting applications for editors:
journals.gla.ac.uk/phj/announce....
journals.gla.ac.uk/phj/announce....
Login
| Population Health Journal
journals.gla.ac.uk
October 24, 2025 at 11:18 AM
We are in the process of creating a new journal for our community, the Population Health Journal, and we are now inviting applications for editors:
journals.gla.ac.uk/phj/announce....
journals.gla.ac.uk/phj/announce....
Crocodile closest to the canoe is one I have heard. Which is fine until an enormous slightly further away steamboat comes along destroying all crocodiles and taking the canoe with it.

A friend of mine has early access to cutting edge corporate jargon, I heard the phrase "let's double-click on that" from him long before anywhere else. I asked him what's new these days and he says it's "the shark closest to your body" for the most urgent issue.
November 20, 2025 at 2:24 PM
Crocodile closest to the canoe is one I have heard. Which is fine until an enormous slightly further away steamboat comes along destroying all crocodiles and taking the canoe with it.
Reposted by Clare Griffiths

As an older, cis woman I include all women in my feminism and stand with trans friends and work colleagues, especially today on Trans Day of Remembrance, when we recognise the continued violence directed toward transgender people.
Trans rights are human rights. 🏳️⚧️
#TDoR2025
Trans rights are human rights. 🏳️⚧️
#TDoR2025
In the lead-up to Trans Day of Remembrance, I won a cross-party commitment on the London Assembly to protecting and advancing trans rights.
It has never been more important for our institutions to stand together unequivocally with the trans community.
It has never been more important for our institutions to stand together unequivocally with the trans community.
November 20, 2025 at 1:15 PM
As an older, cis woman I include all women in my feminism and stand with trans friends and work colleagues, especially today on Trans Day of Remembrance, when we recognise the continued violence directed toward transgender people.
Trans rights are human rights. 🏳️⚧️
#TDoR2025
Trans rights are human rights. 🏳️⚧️
#TDoR2025
Reposted by Clare Griffiths
A huge thank you to Steph, Penny, @mhwauben.bsky.social & Michelle for a pre-Christmas cracker of a Data Bites @publicdigital.bsky.social last night
Watch back bit.ly/databites60
& check out the new StatsWales, the new Stats Code of Practice, the Data for London Library & the Census consultation!
Watch back bit.ly/databites60
& check out the new StatsWales, the new Stats Code of Practice, the Data for London Library & the Census consultation!

Join Slido: Enter #code to vote and ask questions
Participate in a live poll, quiz or Q&A. No login required.
bit.ly
November 19, 2025 at 11:49 AM
A huge thank you to Steph, Penny, @mhwauben.bsky.social & Michelle for a pre-Christmas cracker of a Data Bites @publicdigital.bsky.social last night
Watch back bit.ly/databites60
& check out the new StatsWales, the new Stats Code of Practice, the Data for London Library & the Census consultation!
Watch back bit.ly/databites60
& check out the new StatsWales, the new Stats Code of Practice, the Data for London Library & the Census consultation!
Reposted by Clare Griffiths

⭐ New blog: I've been doing some writing about Service Design recently... In this post, I explain how importance of the shift from product to a "service mindset" …
Thanks to Mica Moore (not on BSky) who contributed to this and provided feedback.
benholliday.com/2025/11/18/f...
#ServiceDesign
Thanks to Mica Moore (not on BSky) who contributed to this and provided feedback.
benholliday.com/2025/11/18/f...
#ServiceDesign

From product to a service mindset
Exploring the need for a service mindset in product-focused organisations.
benholliday.com
November 19, 2025 at 9:37 AM
⭐ New blog: I've been doing some writing about Service Design recently... In this post, I explain how importance of the shift from product to a "service mindset" …
Thanks to Mica Moore (not on BSky) who contributed to this and provided feedback.
benholliday.com/2025/11/18/f...
#ServiceDesign
Thanks to Mica Moore (not on BSky) who contributed to this and provided feedback.
benholliday.com/2025/11/18/f...
#ServiceDesign
I can highly recommend this degree for anyone struggling to understand why in order to estimate migration accurately one might need data. www.lshtm.ac.uk/study/course...

MSc Demography & Health | LSHTM
(also available online)
www.lshtm.ac.uk
November 18, 2025 at 11:44 AM
I can highly recommend this degree for anyone struggling to understand why in order to estimate migration accurately one might need data. www.lshtm.ac.uk/study/course...
Who put the massive flags on Blackheath by the tea hut? Is it the tea hut owners? Can we get the council (Greenwich??) to take them down?
November 17, 2025 at 1:23 PM
Who put the massive flags on Blackheath by the tea hut? Is it the tea hut owners? Can we get the council (Greenwich??) to take them down?
Reposted by Clare Griffiths

Data Bites #60 is tomorrow! Join us in person or online to hear about the brilliant work of practitioners transforming how data is used for the public good.
public.digital/events/data-...
public.digital/events/data-...

November 17, 2025 at 10:24 AM
Data Bites #60 is tomorrow! Join us in person or online to hear about the brilliant work of practitioners transforming how data is used for the public good.
public.digital/events/data-...
public.digital/events/data-...
Reposted by Clare Griffiths

🎉 It’s Union Week!
If you join Prospect this week, you'll get your first three months of membership free! prospect.org.uk/join
Already a member? Now’s the perfect time to spread the word and tell your colleagues about the value of being in a union.
If you join Prospect this week, you'll get your first three months of membership free! prospect.org.uk/join
Already a member? Now’s the perfect time to spread the word and tell your colleagues about the value of being in a union.

November 17, 2025 at 10:36 AM
🎉 It’s Union Week!
If you join Prospect this week, you'll get your first three months of membership free! prospect.org.uk/join
Already a member? Now’s the perfect time to spread the word and tell your colleagues about the value of being in a union.
If you join Prospect this week, you'll get your first three months of membership free! prospect.org.uk/join
Already a member? Now’s the perfect time to spread the word and tell your colleagues about the value of being in a union.
Reposted by Clare Griffiths

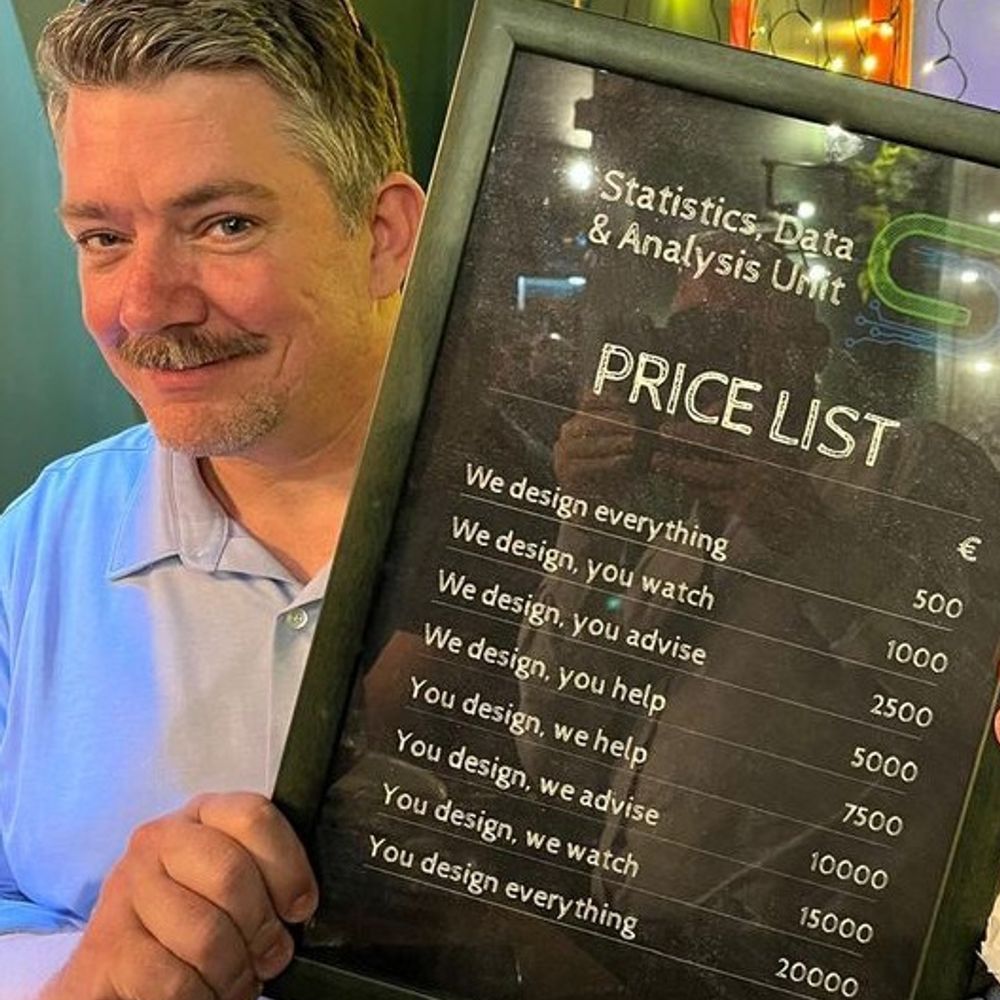
Speakers:
Dr Matthew Voigt (Michigan State University) – Solving for X: The Unknowns of Gender and Sexuality in Tertiary STEM Education
Dr Lexi Webster (University of Southampton) – Let’s Talk About Sex (Data)
Dr Matthew Voigt (Michigan State University) – Solving for X: The Unknowns of Gender and Sexuality in Tertiary STEM Education
Dr Lexi Webster (University of Southampton) – Let’s Talk About Sex (Data)

November 10, 2025 at 7:07 PM
Speakers:
Dr Matthew Voigt (Michigan State University) – Solving for X: The Unknowns of Gender and Sexuality in Tertiary STEM Education
Dr Lexi Webster (University of Southampton) – Let’s Talk About Sex (Data)
Dr Matthew Voigt (Michigan State University) – Solving for X: The Unknowns of Gender and Sexuality in Tertiary STEM Education
Dr Lexi Webster (University of Southampton) – Let’s Talk About Sex (Data)
Reposted by Clare Griffiths

DBT published an evaluation of its use of Copilot, earlier this year. It found no evidence that time savings led to improvements in productivity: www.gov.uk/government/p...

Microsoft 365 Copilot pilot: DBT evaluation report
An evaluation of the Microsoft 365 Copilot pilot by the Department for Business and Trade (DBT), which took place from October to December 2024.
www.gov.uk
November 14, 2025 at 3:50 PM
DBT published an evaluation of its use of Copilot, earlier this year. It found no evidence that time savings led to improvements in productivity: www.gov.uk/government/p...
I could save 2 working days per week by not making 85 people wait 10 minutes for a senior leader to turn up to an all staff call.
I get frustrated by the press release culture around time savings from AI tools. I couldn't resist responding to a recent one about Microsoft Copilot in the NHS. There's still a missing step of being able to reimagine the future of work with technology benholliday.com/2025/10/23/4...
43 minutes per staff member per day
Looking at the latest NHS framing of time savings from investment in AI, and the continued need to better reimagine how we work with technology.
benholliday.com
November 14, 2025 at 3:49 PM
I could save 2 working days per week by not making 85 people wait 10 minutes for a senior leader to turn up to an all staff call.
Please understand that if I send you an email on a Friday I am clearing my desk and I do not want a reply until Monday.
November 14, 2025 at 2:43 PM
Please understand that if I send you an email on a Friday I am clearing my desk and I do not want a reply until Monday.
Reposted by Clare Griffiths

Every time this kind of thing comes round it's because the people saying this are remembering being kids and of course the world seems better when someone else is worrying about taking care of you and you can spend most of your time just riding bikes.
Ah the 1970s.
Stagflation, three day weeks, collapsing infrastructure. Civil War in Northern Ireland. In yer face racism and bigotry everywhere. Bin strikes. Strikes in general. Blackouts. Industrial decline. Wage inequality. Dog crap everywhere. And households spent 25% of their income on food.
Stagflation, three day weeks, collapsing infrastructure. Civil War in Northern Ireland. In yer face racism and bigotry everywhere. Bin strikes. Strikes in general. Blackouts. Industrial decline. Wage inequality. Dog crap everywhere. And households spent 25% of their income on food.

November 14, 2025 at 8:44 AM
Every time this kind of thing comes round it's because the people saying this are remembering being kids and of course the world seems better when someone else is worrying about taking care of you and you can spend most of your time just riding bikes.
Reposted by Clare Griffiths
Join us in person or online for Data Bites #60 on Tuesday 18 November at 6pm.
Our monthly events series spotlights the digital practitioners transforming how data is used to serve the public.
Check out this month's speakers and book your place:
public.digital/events/data-...
Our monthly events series spotlights the digital practitioners transforming how data is used to serve the public.
Check out this month's speakers and book your place:
public.digital/events/data-...

November 7, 2025 at 4:07 PM
Join us in person or online for Data Bites #60 on Tuesday 18 November at 6pm.
Our monthly events series spotlights the digital practitioners transforming how data is used to serve the public.
Check out this month's speakers and book your place:
public.digital/events/data-...
Our monthly events series spotlights the digital practitioners transforming how data is used to serve the public.
Check out this month's speakers and book your place:
public.digital/events/data-...
Reposted by Clare Griffiths

The @royalstatsoc.bsky.social annual international conference is now on bluesky and looking forward to our conference in Bournemouth next September: rss.org.uk/training-eve... #RSS2026conf

November 13, 2025 at 4:24 PM
The @royalstatsoc.bsky.social annual international conference is now on bluesky and looking forward to our conference in Bournemouth next September: rss.org.uk/training-eve... #RSS2026conf
Reposted by Clare Griffiths

Me: Ditches Amazon because Jeff Bezos sided with the far-right
Me a few weeks later: Realize that many “independent” shops run on Shopify, a company also run by a far-right CEO
Hear me out: a tech industry, but that does not suck
Me a few weeks later: Realize that many “independent” shops run on Shopify, a company also run by a far-right CEO
Hear me out: a tech industry, but that does not suck

Shopify’s Right-Wing Inner Circle w/ Luke LeBrun & Rachel Gilmore - Tech Won’t Save Us
techwontsave.us
November 12, 2025 at 9:19 PM
Me: Ditches Amazon because Jeff Bezos sided with the far-right
Me a few weeks later: Realize that many “independent” shops run on Shopify, a company also run by a far-right CEO
Hear me out: a tech industry, but that does not suck
Me a few weeks later: Realize that many “independent” shops run on Shopify, a company also run by a far-right CEO
Hear me out: a tech industry, but that does not suck
New data on the causes of death driving inequalities in life expectancy at a local level. The life expectancy gap is determined by higher mortality in deprived areas across a range of causes of death. Circulatory diseases, cancer and respiratory diseases contributed almost 60% of the gap in 2022/23.

Segment tool: statistical commentary, November 2025
www.gov.uk
November 12, 2025 at 1:44 PM
New data on the causes of death driving inequalities in life expectancy at a local level. The life expectancy gap is determined by higher mortality in deprived areas across a range of causes of death. Circulatory diseases, cancer and respiratory diseases contributed almost 60% of the gap in 2022/23.
Reposted by Clare Griffiths

📢 Now open: BSPS 2026 Call for sessions and strands. Come and join us in Canterbury. 8-10 September 2026: www.lse.ac.uk/internationa...
November 6, 2025 at 3:45 PM
📢 Now open: BSPS 2026 Call for sessions and strands. Come and join us in Canterbury. 8-10 September 2026: www.lse.ac.uk/internationa...
Reposted by Clare Griffiths

Wondering why no one likes your posts anymore, even among your friends? It's because @jay.bsky.team and team have decided to hide a huge amount of content from all of our feeds by default.
Here's how to turn it off.
First go to the hamburger menu in the upper left corner
Here's how to turn it off.
First go to the hamburger menu in the upper left corner

November 6, 2025 at 6:23 PM
Wondering why no one likes your posts anymore, even among your friends? It's because @jay.bsky.team and team have decided to hide a huge amount of content from all of our feeds by default.
Here's how to turn it off.
First go to the hamburger menu in the upper left corner
Here's how to turn it off.
First go to the hamburger menu in the upper left corner
Reposted by Clare Griffiths

Not since 1998 has an entire nation simultaneously banged the table and shouted “oh for fucks sake David” #CelebrityTraitors

November 7, 2025 at 10:39 AM
Not since 1998 has an entire nation simultaneously banged the table and shouted “oh for fucks sake David” #CelebrityTraitors
Reposted by Clare Griffiths
The advances we've made in statistics, experimental study design, and causal inference over the past century are remarkably useful for understanding our world. But there is never been a push to make people use them like we are seeing with generative AI. Perhaps take a moment to consider why.
November 7, 2025 at 9:07 AM
The advances we've made in statistics, experimental study design, and causal inference over the past century are remarkably useful for understanding our world. But there is never been a push to make people use them like we are seeing with generative AI. Perhaps take a moment to consider why.