Evert de Froe
@evertdefroe.bsky.social
280 followers 730 following 5 posts
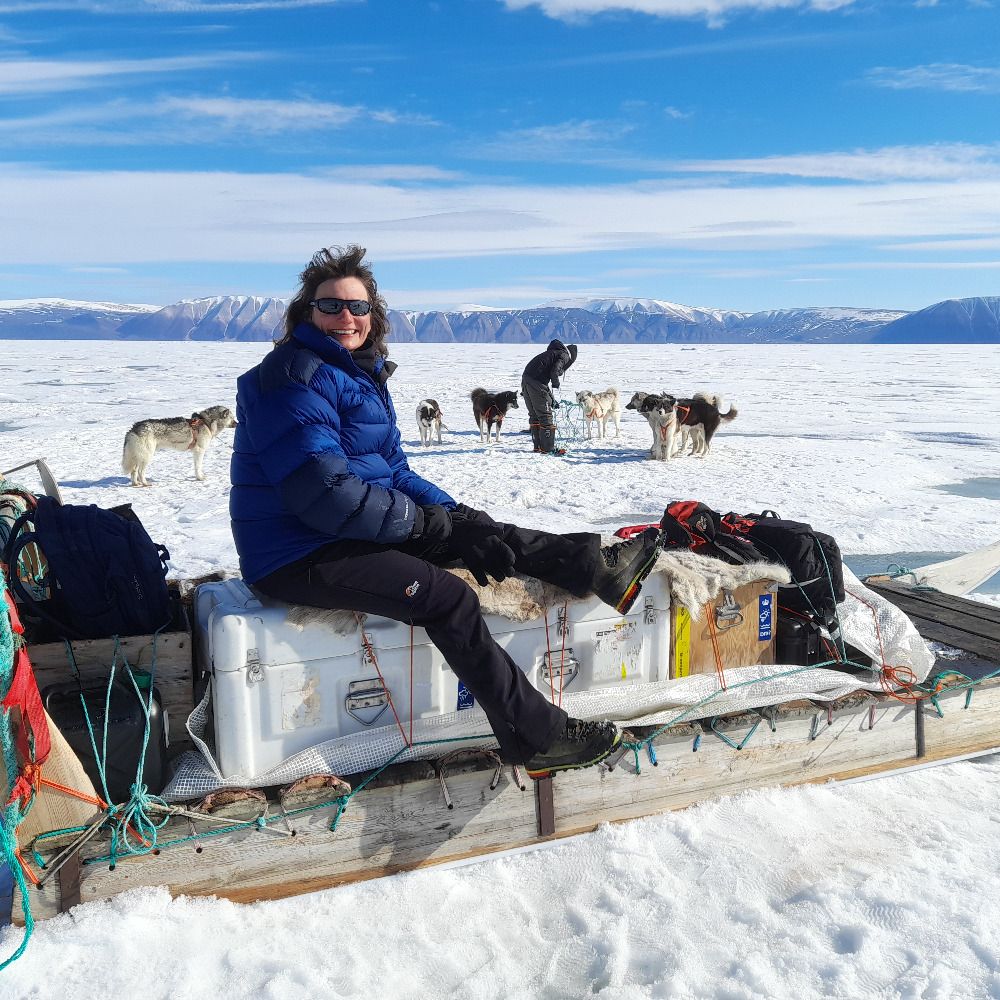
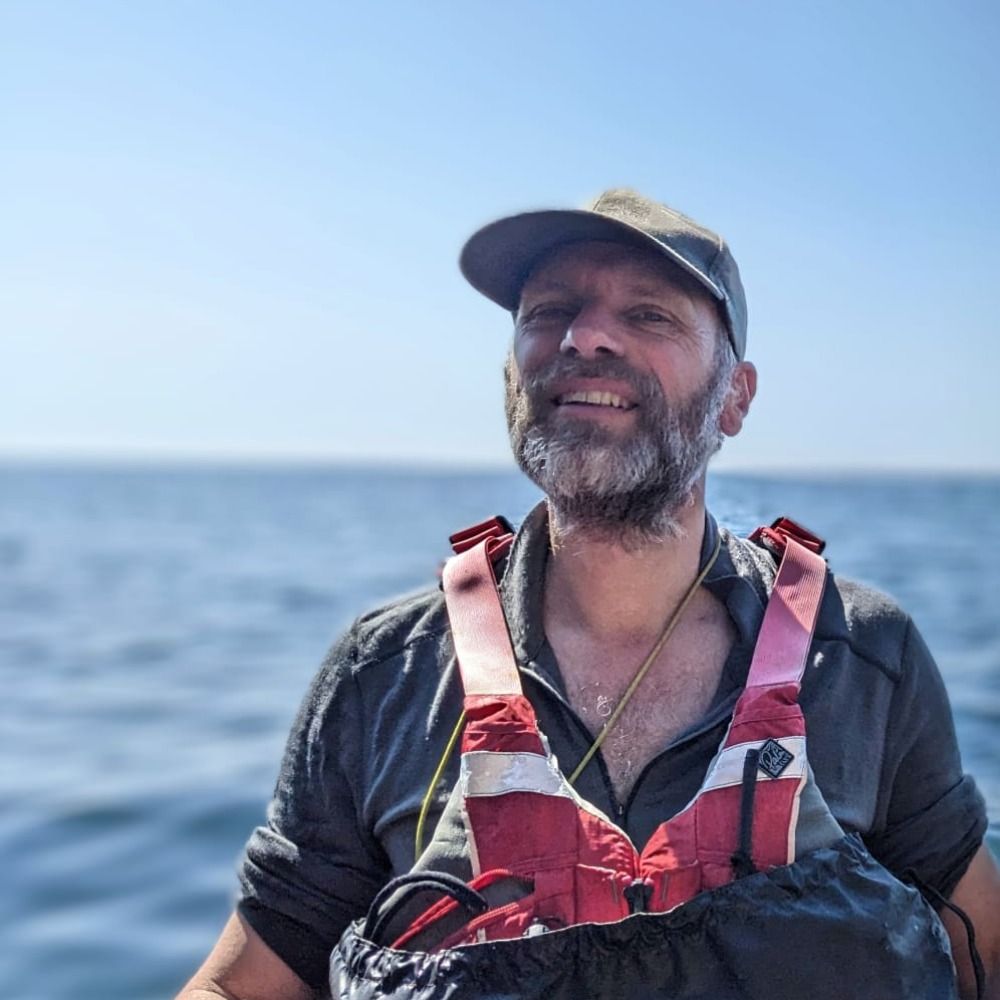
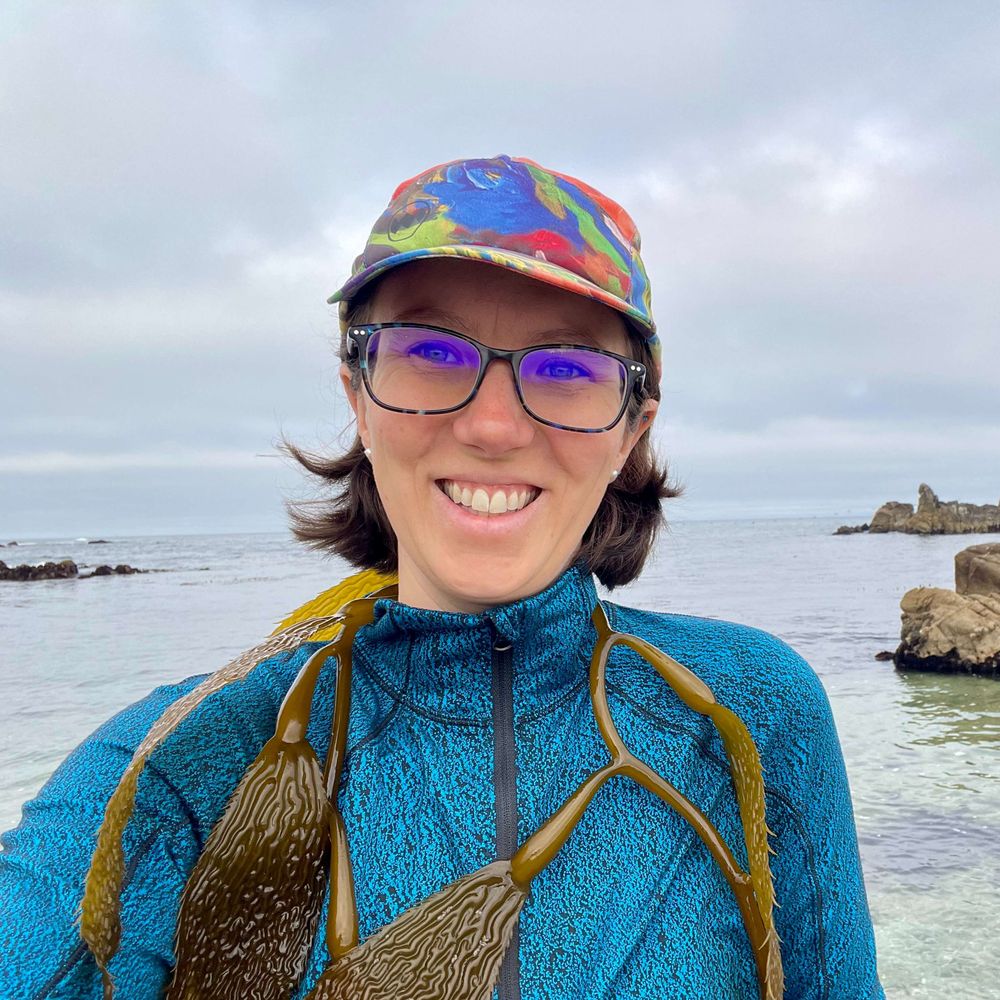
Marine scientist at Wageningen Marine Research in the Netherlands. Studying estuarine and Arctic ecosystems. https://www.researchgate.net/profile/Evert-De-Froe
Posts Media Videos Starter Packs
Reposted by Evert de Froe
science.org
“I will miss the creativity of teaching.”

On #WorldTeachersDay, check out this #ScienceWorkingLife essay from a retired professor emeritus on how she challenged students to think beyond facts—and how she learned to teach like a scientist. https://scim.ag/4nvwosR
People diving into a pool of books and figures, with text: How I learned to teach like a scientist
Reposted by Evert de Froe
icesmarine.bsky.social
🚨Advice release - widely distributed fish stocks

ICES advice to @ec.europa.eu, UK #Defra, Norway #Fiskeridirektoratet & the North-East Atlantic Fisheries Commission #NEAFC on fishing opportunities for widely distributed stocks in 2026 is now available:
🌊 ices-library.figshare.com/collections/...
Reposted by Evert de Froe
jangeerthiddink.bsky.social
Another critique showing that the Sala et al. 2021 estimate of carbon release by bottom trawling is ridiculous.

It estimates an increase in NW European shelf OC mineralization of 0.27 Mt C yr−1, which is an order of magnitude smaller the previous estimates.

academic.oup.com/icesjms/arti...
Reconciling the impact of mobile bottom-contact fishing on marine organic carbon sequestration
Abstract. Anthropogenic activities that disturb the seafloor inadvertently affect the organic carbon cycle. Mobile bottom-contacting fishing (MBCF) is a wi
academic.oup.com
Reposted by Evert de Froe
jaytcullen.bsky.social
🌊 More images from Otto Fiord which is above 80 N on the west side of Ellesmere Island, Nunavut 🇨🇦 in the Arctic. Sofie Ohrling is heading out from the icebreaker on a zodiac to sample near the glacier front and nearshore for trace elements @geotraces.bsky.social @uvicscience.bsky.social
Reposted by Evert de Froe
brookeweigel.bsky.social
Fascinating dive in a kelp forest to urchin barren transition zone yesterday in Monterey! 🌊🤿
Reposted by Evert de Froe
ecography.bsky.social
Correcting environmental sampling bias improves transferability of species distribution models vist.ly/46kcu #ENM #GBIF
Reposted by Evert de Froe
matiasimunoz.bsky.social
Do birds tune their songs to their hearing?

Is there tight coevolution between avian vocal signals and hearing-or do signallers and perceivers evolve more loosely?

It turns out perfect tuning is not required...

Preprint: www.biorxiv.org/content/10.1...

#bioacoustics
#prattle 💬
#ornithology 🪶
Reposted by Evert de Froe
simongerman600.bsky.social
How much do tides vary at your shoreline? The greatest variation can be found at the Bay of Fundy in North America where tide variation reaches 16 meters. It's a fascinating map to study. Have a look at the coastal areas that you are familiar with from your travels.
Reposted by Evert de Froe
science.org
Light pollution is causing birds around the world to sing for longer each day, prolonging their vocalizations on average by 50 minutes, according to a new study in Science.

Learn more: https://scim.ag/3Uz7vzP
A figure showing that light pollution prolongs avian vocal activity by nearly an hour. (A) Most diurnal bird species show bimodal vocalization patterns with peaks in the morning and evening; in light-polluted landscapes (yellow shading), the first vocalizations occur earlier in the morning and the last vocalizations occur later in the evening. (B) Globally—averaged across species, space, and season—onset of morning vocalization shifted 18 min earlier in the brightest landscapes versus the darkest landscapes. (C) Similarly, evening cessation was delayed by an average of 32 min. In (B) and (C), lines are means and shaded regions are 95% confidence intervals (CI) of model predictions.
Reposted by Evert de Froe
pnas.org
Pacific oysters in British Columbia died in a mass mortality event in 2020. A study identifies the cause: Pacific Oyster Nidovirus 1. The virus possesses one of the largest reported genomes for an RNA virus at 64,331 base pairs. In PNAS: www.pnas.org/doi/10.1073/...
Pacific oysters (C. (M.) gigas). 
CREDIT: Amy M. Chan, University of British Columbia
Reposted by Evert de Froe
judithsmit.bsky.social
Interested in doing a 3-month #internship on treehopper vibrational communication at STRI in Panama? 🤩 Check this out:

stri.si.edu/academic-pro...

Contact me for more info! #AnimalBehavior
Reposted by Evert de Froe
datavisfriendly.bsky.social
#rstats So chuffed! I printed the first PDF copy of my book to see what it might look like in print! It will be printed in full color!

Visualizing Multivariate Data and Models in R

On the whole, looks good, but lots of tweaking to do.
It weighs in at ~440 pgs., so perhaps some cutting needed.
Photo of me holding a printed copy of my book Draft cover art Two -page spread showing graphs text and code Two -page spread showing graphs text and code
Reposted by Evert de Froe
willgearty.bsky.social
📢 deeptime: an R package that facilitates highly customizable and reproducible visualizations of data over geological time intervals

🔗 doi.org/10.1080/2096...

Fully #openaccess in @bigearthdata1.bsky.social with insight about deeptime📦 development and code examples!

#rstats #geology #paleontology
Plot of global benthic δ18O data for 0 – 5.3 Ma (Lisiecki & Raymo, 2005) with geomagnetic polarity subchrons displayed on the top x-axis and planktic foraminiferal primary biozones plotted on the bottom x-axis using the deeptime package. A mammal phylogeny (Garland et al., 1992) plotted in the fan layout using the ggtree and deeptime packages. The greyscale concentric circles in the background indicate geological stages, whereas the linear colored timescale indicates geological epochs. Early tetrapod occurrence data (Jones et al., 2023) plotted as a taxonomic/biostratigraphic range plot using the geom_points_range() function from the deeptime package. A stratigraphic column of Cretaceous lithostratigraphic units from the San Juan Basin, USA. The deeptime package has been used to add pattern fill which indicate the primary lithologies of the units as reported by the Macrostrat API (Peters et al., 2018) via the rmacrostrat R package (Jones et al., 2024).