Scholar

Du Toit

du Toit is an Afrikaans surname of French origin, originally from François du Toit, a Huguenot who moved to South… more

H-index: 51
Environmental science 54%
Geography 13%
peterdutoit.com
Emissions between 2019 and 2020 fell by 4.7% - the biggest decline coming from transportation (land & air)

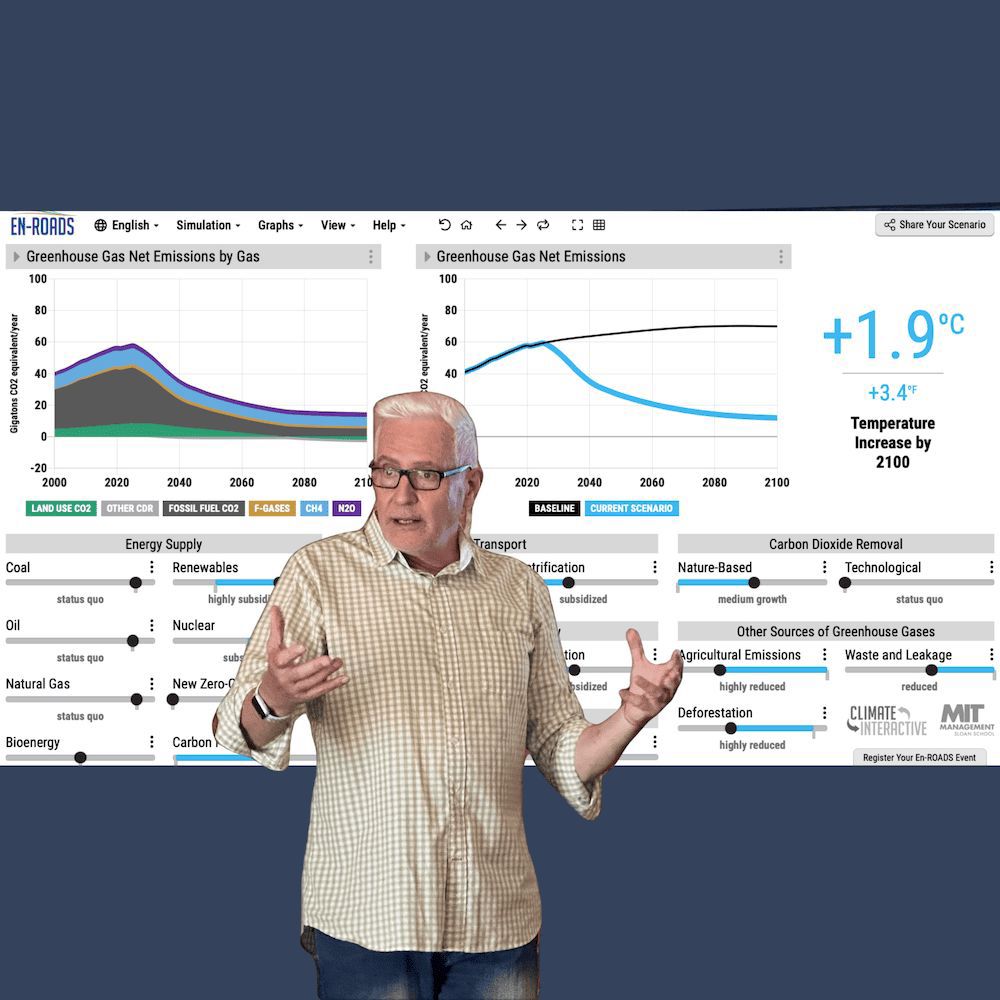
To stay below 2°C emissions MUST fall by 5.5% EVERY year from now until 2030.

We know how to do this!

🚶or 🚲 to work if you can
🚋 use public transport more
🚗 drive less
✈️ fly less
peterdutoit.com
NEW from C3S/ECMWF - September instrument analysis (ERA5 dataset)

+1.47°C above 1850-1900 average
+1.51°C current 12-month running mean

Sea Surface Temperatures 3rd highest on record

Analysis here: climate.copernicus.e...
Graphic showing 12-month runing mean as +1.51°C  in the ERA5 dataset Graphic showing Daily sea surface temperature for 60°S-60°N. 2025 shown as 3rd highest on record

Reposted by: Du Toit, Silvia Secchi

adriftalchemist.bsky.social
kotzebue, alaska declared a mandatory evacuation order
peterdutoit.com
Sunny day flooding is happening regularly where we are. The red areas on the map are areas projected to be below the annual flood line in 2030.

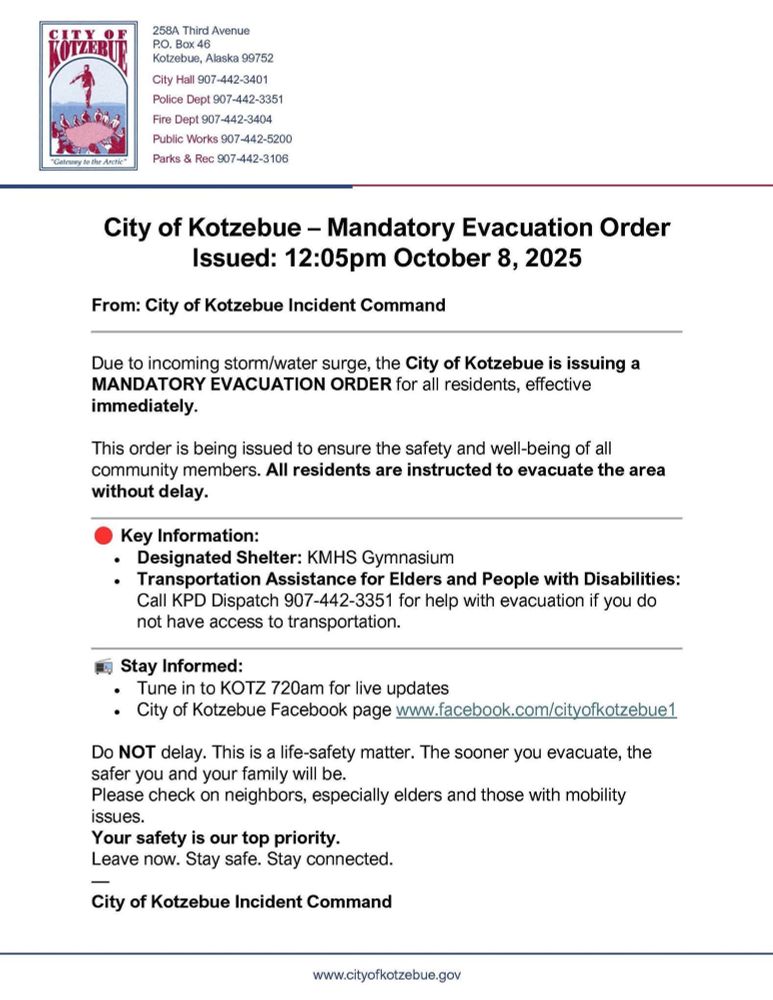
High tides and storm surges flood the streets easily.

NASA #SeaLevelRise projection by 2030 for this area 0.11m.

Stranded assets on the horizon!
Graphic showing flood risks for Knysna South Africa with a photo of tidal street flooding on October 7th

Reposted by: Du Toit

bmcnoldy.bsky.social
A trio of cyclonic eddies in the Gulf of Mexico are creating record-high Ocean Heat Content values for the date. Absolutely something of importance during this part of hurricane season.
@miamirosenstiel.bsky.social

Reposted by: Du Toit

climatologist49.bsky.social
September climate warming stripes. It's as if something has changed. 🤔

Reposted by: Du Toit

copernicusecmwf.bsky.social
🌍 New app features! The #C3S Climate Pulse app just got even better, with smoother navigation, fullscreen views, advanced chart editing, customisable downloads and new map projections. Watch our How To video and explore the app 👉 pulse.climate.copernicus.eu

#CopernicusClimate

Reposted by: Du Toit

henryjfoy.ft.com
Washington has asked Brussels to scrap requirements for non-EU companies to provide “climate transition plans” and to change supply chain legislation to exclude US companies “with high-quality corporate due diligence”, according to a document seen by @financialtimes.com

on.ft.com/46Ijpye
US demands EU dismantle green regulations in threat to trade deal
[FREE TO READ] Washington wants American companies to be exempted from rules such as having to draw up climate transition plans
on.ft.com

Reposted by: Du Toit

zacklabe.com
The Relative Oceanic Niño Index (RONI) continues to show our gradual shift to more La Niña-like conditions in the equatorial Pacific Ocean. Seasonal forecast models still highlight a La Niña emerging through this coming boreal winter

Graphic updated in near-real time at zacklabe.com/climate-chan...
Time series of the relative oceanic nino index (RONI) from 1950 to 2025. Labels are shown for El Nino or La Nina conditions. There is significant variability over time.
peterdutoit.com
US drags down global renewable energy growth for forecast period 2025-2030

Not only have they added more GHG pollution to the atmosphere than any other nation on earth, they are now sabotaging renewable energy.

Hope the world leaves them behind!

Source: iea.blob.core.window...
Global renewable growth forecast revised down slightly

Renewable capacity additions forecast revisions for 2025-2030

United States showing a ~45% decline
hausfath.bsky.social
And here is the percentage of the world's land area setting a new all-time monthly maximum temperature record in each decade:
peterdutoit.com
Deleted and reposted with corrections:
peterdutoit.com
In the 2025 EDGAR Report the US no longer holds poll position for emissions per capita (t CO2e/Cap) in 2024.

1st: Saudi Arabia - 22.8
2nd: Australia - 22.3
3rd: Canada - 19.6
4th: Russia - 18
5th: United States - 17.3

Data: edgar.jrc.ec.europa.eu/report_2025
2024 GHG emissions (Mt CO2eq), shares in global emissions13, changes relative to 202314, emissions per capita (t CO2eq/cap), and CAGR15 (1990-2024) (%) for countries and regions accounting for over 1% of global GHG emissions, including international aviation and international shipping.
peterdutoit.com
You are absolutely right am deleting and reposting
peterdutoit.com
Building resilience before an extreme event prevents you from being taken below a tipping point from which full recovery is not possible.

Since we are sailing through 1.5ºC of heating it is smart to create a resilience plan for your family, business or community if you have not already done so!
Graphic showing the trajectory of building resilience vs not doing so and the impact of an extreme event
peterdutoit.com
How influential is X generally in the Canadian context with only ~17% usage?

environics.ca/insights/art...
Social Media Usage Year-Over-Year
2025

Graph Insights Credit: Environics Research

Reposted by: Du Toit

nickcunningham.bsky.social
If you want to follow events in Portland, don’t read NYT.

Follow local reporters who know their community

@alexzee.bsky.social
@alexbaumhardt.bsky.social
@taylorgriggs.bsky.social
@gosiawoz.bsky.social
peterdutoit.com
10 things we can do to slash oil demand.

We have the know-how.
We just need to act!

#ClimateCrisis #Mitigation
peterdutoit.com
I agree.

There is no wiggle room here.

If this is the emergency we claim it is, we sure better act that way!

(2022) IPCC WGIII Chap. 5: www.ipcc.ch/report/ar6/w...
The indicative potential of demand-side strategies to reduce
emissions of direct and indirect CO2 and non-CO2 GHG emissions
in three end-use sectors (buildings, land transport, and food) is
40–70% globally by 2050 (high confidence). Technical mitigation
potentials compared to the 2050 emissions projection of two scenarios
consistent with policies announced by national governments until 2020
amount to 6.8 GtCO2 for building use and construction, 4.6 GtCO2 for
land transport and 8.0 GtCO2-eq for food demand, and amount to
4.4 GtCO2 for industry. Mitigation strategies can be classified as Avoid-Shift-Improve (ASI) options, that reflect opportunities for socio-cultural, infrastructural, and technological change. The greatest ‘Avoid’ potential comes from reducing long-haul aviation and providing short-distance low-carbon urban infrastructures. The greatest ‘Shift’ potential would come from switching to plant-based diets. The greatest ‘Improve’ potential comes from within the building sector, and in particular increased use of energy-efficient end-use technologies and passive housing. {5.3.1, 5.3.2, Figure 5.7, Figure 5.8, Table 5.1, Chapter 5
Supplementary Material II, Table 5.SM.2}
peterdutoit.com
“This marks the second time Thunberg has been arrested alongside other flotilla members, after a similar attempt earlier this year ended with the activists’ arrest and deportation”
peterdutoit.com
At ~1.5°C of heating we have left the safe zone and we are not prepared for the impacts.

Bulgaria flood details here:

www.straitstimes.com/world/europe...

#ClimateCrisis #Flashoods

References

Fields & subjects

Updated 1m