


Kate Moran
@katemoran.bsky.social
🇨🇦Global citizen for kindness, climate action, ocean protection. Leguminati. Views are my own.
Reposted by Kate Moran

"Adoption of electric vehicles (EVs) and heat pumps collectively saved US households between $5.6 to $8.8 billion in 2023 alone."
"80% of users are satisfied with their heat pumps, and nearly 95% of EV owners are likely to consider purchasing another EV for their next vehicle."
"80% of users are satisfied with their heat pumps, and nearly 95% of EV owners are likely to consider purchasing another EV for their next vehicle."

New Brattle Report Finds Beneficial Electrification Delivers Billions in Savings to US Households Along with Significant Emissions Reductions - Brattle
Harnessing the benefits of electric technology over the last decade saved US households between $5.6 to $8.8 billion in 2023 alone and prevented more than
www.brattle.com
November 25, 2025 at 8:39 PM
"Adoption of electric vehicles (EVs) and heat pumps collectively saved US households between $5.6 to $8.8 billion in 2023 alone."
"80% of users are satisfied with their heat pumps, and nearly 95% of EV owners are likely to consider purchasing another EV for their next vehicle."
"80% of users are satisfied with their heat pumps, and nearly 95% of EV owners are likely to consider purchasing another EV for their next vehicle."
Reposted by Kate Moran

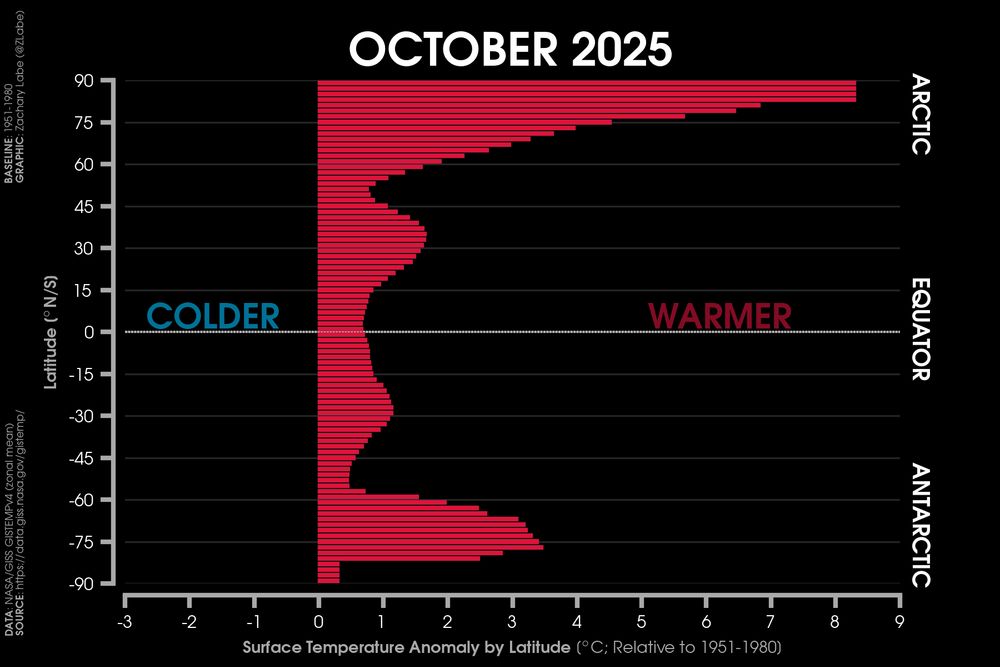
Take a look at this... Remarkable "warmth" last month across both polar regions when visualizing temperature departures by latitude. The x-axis is quite stretched out here compared to my usual monthly update of this graphic.
GISTEMPv4 using their 1951-1980 baseline (data.giss.nasa.gov/gistemp/).
GISTEMPv4 using their 1951-1980 baseline (data.giss.nasa.gov/gistemp/).
November 20, 2025 at 9:16 PM
Take a look at this... Remarkable "warmth" last month across both polar regions when visualizing temperature departures by latitude. The x-axis is quite stretched out here compared to my usual monthly update of this graphic.
GISTEMPv4 using their 1951-1980 baseline (data.giss.nasa.gov/gistemp/).
GISTEMPv4 using their 1951-1980 baseline (data.giss.nasa.gov/gistemp/).
Essential data for climate adaptation action! Other states and countries should follow.
CalHeatScore is a first-of-its-kind system that ranks heat risk at the zip code level by combining fine-scale climate + weather information, along with emergency department data to tell more granular stories of heat & health for every community across the state. ow.ly/Hxgn50XuWqI
#gischat 🧪 #geogsky
#gischat 🧪 #geogsky

November 20, 2025 at 8:45 PM
Essential data for climate adaptation action! Other states and countries should follow.
"Guided by the core principles..including the United Nations Convention on the Law of the sea..Canada & Sweden are committed to strengthening our collaboration to address the complex global challenges in the Arctic and maintain the region as secure, peaceful, and prosperous."

More here: www.pm.gc.ca/en/news/stat...

Joint statement by Prime Minister Carney and Prime Minister Kristersson
We are like-minded Arctic nations with shared interests in the North Atlantic and the Arctic region, and who recognise the vital contributions and rights of Indigenous Peoples in the Arctic in keeping...
www.pm.gc.ca
November 18, 2025 at 11:18 PM
"Guided by the core principles..including the United Nations Convention on the Law of the sea..Canada & Sweden are committed to strengthening our collaboration to address the complex global challenges in the Arctic and maintain the region as secure, peaceful, and prosperous."

Reposted by Kate Moran

NEW: Epstein survivors release the most powerful PSA I have ever seen.
Make this go viral so every member of the House of Representatives sees it.
Make this go viral so every member of the House of Representatives sees it.
November 16, 2025 at 11:43 PM
NEW: Epstein survivors release the most powerful PSA I have ever seen.
Make this go viral so every member of the House of Representatives sees it.
Make this go viral so every member of the House of Representatives sees it.
Reposted by Kate Moran
Greenhouse gas data is finally rolling in again, and my dashboard is back up-to-date. Unfortunately, the story hasn’t changed... 📈
More climate change indicator graphics at zacklabe.com/climate-chan...
More climate change indicator graphics at zacklabe.com/climate-chan...

November 16, 2025 at 2:10 AM
Greenhouse gas data is finally rolling in again, and my dashboard is back up-to-date. Unfortunately, the story hasn’t changed... 📈
More climate change indicator graphics at zacklabe.com/climate-chan...
More climate change indicator graphics at zacklabe.com/climate-chan...
Reposted by Kate Moran

America's most notorious child rapist, Jeffrey Epstein, said this man was the worst person he'd ever met. Let that sink in.

November 14, 2025 at 12:36 AM
America's most notorious child rapist, Jeffrey Epstein, said this man was the worst person he'd ever met. Let that sink in.
Reposted by Kate Moran

Ahead of Veterans Day, I was honored to welcome a flight of veterans and their families as they arrived in DC.
November 11, 2025 at 1:08 PM
Ahead of Veterans Day, I was honored to welcome a flight of veterans and their families as they arrived in DC.
Reposted by Kate Moran

![Comic. Someone is claiming to predict the exact date of a future earthquake. Should you listen? [flowchart: start] → NO (There are big earthquakes constantly, so if anyone ever *does* figure this out, it will be immediately obvious that their method works and then the world’s seismologists will not shut up about it. You won’t need this flowchart.)](https://cdn.bsky.app/img/feed_thumbnail/plain/did:plc:cz73r7iyiqn26upot4jtjdhk/bafkreic7wdqg4w6qfevbqzzq4esd6237pojsnpwsrbb7gaxsxobqaiwazm@jpeg)
November 10, 2025 at 8:55 PM
Reposted by Kate Moran
Record high ocean temperatures continued across the North Pacific in October 2025, with recent warming really amplifying since the early 2000s.
This graph shows the average for a band across the midlatitudes for every October from 1854-2025 using
NOAA ERSSTv5 data (psl.noaa.gov/data/gridded...).
This graph shows the average for a band across the midlatitudes for every October from 1854-2025 using
NOAA ERSSTv5 data (psl.noaa.gov/data/gridded...).

November 9, 2025 at 5:43 PM
Record high ocean temperatures continued across the North Pacific in October 2025, with recent warming really amplifying since the early 2000s.
This graph shows the average for a band across the midlatitudes for every October from 1854-2025 using
NOAA ERSSTv5 data (psl.noaa.gov/data/gridded...).
This graph shows the average for a band across the midlatitudes for every October from 1854-2025 using
NOAA ERSSTv5 data (psl.noaa.gov/data/gridded...).
Reposted by Kate Moran
Wild. They are figuring out how to store electricity in ... concrete.

Concrete “battery” developed at MIT now packs 10 times the power
New concrete and carbon black supercapacitors with optimized electrolytes have 10 times the energy storage of previous designs and can be incorporated into a wide range of architectural forms.
news.mit.edu
November 9, 2025 at 8:09 PM
Wild. They are figuring out how to store electricity in ... concrete.
Reposted by Kate Moran

"Not TV or illegal drugs but the automobile has been the chief destroyer of...communities." ― Jane Jacobs

November 7, 2025 at 11:59 AM
"Not TV or illegal drugs but the automobile has been the chief destroyer of...communities." ― Jane Jacobs
Reposted by Kate Moran

Although we're not where we should be, we're on a significantly better trajectory than we were 10 years ago.

10 Years After the Paris Climate Agreement, Here's Where We Are (Gift Article)
Has anything really changed in the decade since the Paris Agreement was reached? Actually, quite a lot.
www.nytimes.com
November 7, 2025 at 6:13 PM
Although we're not where we should be, we're on a significantly better trajectory than we were 10 years ago.
This is all on Elon Musk.

One analytical model shows that, as of November 5th, the dismantling of U.S.A.I.D. has already caused the deaths of 600,000 people, two-thirds of them children. https://newyorkermag.visitlink.me/jUzNSc

The Shutdown of U.S.A.I.D. Has Already Killed Hundreds of Thousands
The short documentary “Rovina’s Choice” tells the story of what goes when aid goes.
newyorkermag.visitlink.me
November 7, 2025 at 3:21 AM
This is all on Elon Musk.
Reposted by Kate Moran
Today is a good day to be an American who doesn’t want to see oligarchic authoritarianism replace democracy.
Enjoy.
Enjoy.
November 5, 2025 at 1:35 PM
Today is a good day to be an American who doesn’t want to see oligarchic authoritarianism replace democracy.
Enjoy.
Enjoy.
Reposted by Kate Moran

This person took this when they called the race
November 5, 2025 at 6:07 AM
This person took this when they called the race
Reposted by Kate Moran

Huge congratulations to Harvard’s Naomi Oreskes for winning the Volvo prize! She is a pioneer in unmasking the financial interests and methods behind climate science denial.
I’m proud to have published with her how Exxon knew exactly what they were doing.
www.environment-prize.com/laureates/na...
I’m proud to have published with her how Exxon knew exactly what they were doing.
www.environment-prize.com/laureates/na...

Naomi Oreskes - Volvo Environment Prize
Harvard Professor Naomi Oreskes, a world-renowned earth scientist and historian, is the laureate of the 2025 Volvo Environment Prize. She is recognized for her influential work on the history of scien...
www.environment-prize.com
November 3, 2025 at 3:29 PM
Huge congratulations to Harvard’s Naomi Oreskes for winning the Volvo prize! She is a pioneer in unmasking the financial interests and methods behind climate science denial.
I’m proud to have published with her how Exxon knew exactly what they were doing.
www.environment-prize.com/laureates/na...
I’m proud to have published with her how Exxon knew exactly what they were doing.
www.environment-prize.com/laureates/na...
Love the Jays and Canada 🇨🇦
October 30, 2025 at 3:14 AM
Love the Jays and Canada 🇨🇦
Thank you for sharing this video. I wept with hope. It is a must view.
Seriously listen to this. This is it. This is the message, this is the tone, this is it! Why aren't all Dems talking like this? Why aren't they clearly articulating & defending their values? Why isn't AOC being celebrated & elevated by the people who claim to want to hear this stuff from Dems?
October 29, 2025 at 2:51 AM
Thank you for sharing this video. I wept with hope. It is a must view.
Reposted by Kate Moran
God I am listening to @aoc.bsky.social unapologetically celebrating cities -- urbanity, diversity, creativity, decency -- and it is giving me life.
Nothing but respect for *my* president.
Nothing but respect for *my* president.

"We Are NOT the Crazy Ones, NYC" — AOC Fires Up Queens Rally for Zohran Mamdani | APT
YouTube video by APT
www.youtube.com
October 28, 2025 at 9:25 PM
God I am listening to @aoc.bsky.social unapologetically celebrating cities -- urbanity, diversity, creativity, decency -- and it is giving me life.
Nothing but respect for *my* president.
Nothing but respect for *my* president.
Reposted by Kate Moran

Hurricane #Melissa explosively intensified into a Category 5 storm over exceptionally warm Caribbean waters.
Here's how climate change amplified this dangerous hurricane—from its rapid strengthening to the catastrophic rainfall ahead ⤵️
youtube.com/shorts/VtbZZ...
Here's how climate change amplified this dangerous hurricane—from its rapid strengthening to the catastrophic rainfall ahead ⤵️
youtube.com/shorts/VtbZZ...

Hurricane #Melissa and Climate Change
YouTube video by climatecentral
youtube.com
October 28, 2025 at 3:01 AM
Hurricane #Melissa explosively intensified into a Category 5 storm over exceptionally warm Caribbean waters.
Here's how climate change amplified this dangerous hurricane—from its rapid strengthening to the catastrophic rainfall ahead ⤵️
youtube.com/shorts/VtbZZ...
Here's how climate change amplified this dangerous hurricane—from its rapid strengthening to the catastrophic rainfall ahead ⤵️
youtube.com/shorts/VtbZZ...
Cross the aisle!

As most lawmakers stay home during the shutdown, Rep. Kevin Kiley, R-Calif., keeps reporting to his Capitol Hill office, urging Congress to return to work and end the standoff.

Why this Republican lawmaker is still showing up to work during the shutdown
As most lawmakers stay home during the shutdown, Rep. Kevin Kiley, R-Calif., keeps reporting to his Capitol Hill office, urging Congress to return to work and end the standoff.
n.pr
October 28, 2025 at 10:23 AM
Cross the aisle!
Reposted by Kate Moran
Some perspective on this year's sea surface temperatures and recent warming across the North Pacific... 🌊
This graph shows the average for a band across the midlatitudes for every average January-September period from 1854-2025 using ERSSTv5 data.
This graph shows the average for a band across the midlatitudes for every average January-September period from 1854-2025 using ERSSTv5 data.

October 26, 2025 at 2:53 PM
Some perspective on this year's sea surface temperatures and recent warming across the North Pacific... 🌊
This graph shows the average for a band across the midlatitudes for every average January-September period from 1854-2025 using ERSSTv5 data.
This graph shows the average for a band across the midlatitudes for every average January-September period from 1854-2025 using ERSSTv5 data.