Tim Osborn
@timosbornclim.bsky.social
2.4K followers 480 following 270 posts
Climate variability and change | Professor of Climate Science & Director of Climatic Research Unit | UEA | Views expressed here are my own, not UEA's
Posts Media Videos Starter Packs
Pinned
timosbornclim.bsky.social
Some people are mis-using IPCC Table 12.12 to falsely claim that the latest IPCC assessment is that most types of extreme weather have not increased. Thread to explain why they're wrong.
Reposted by Tim Osborn
wmo-global.bsky.social
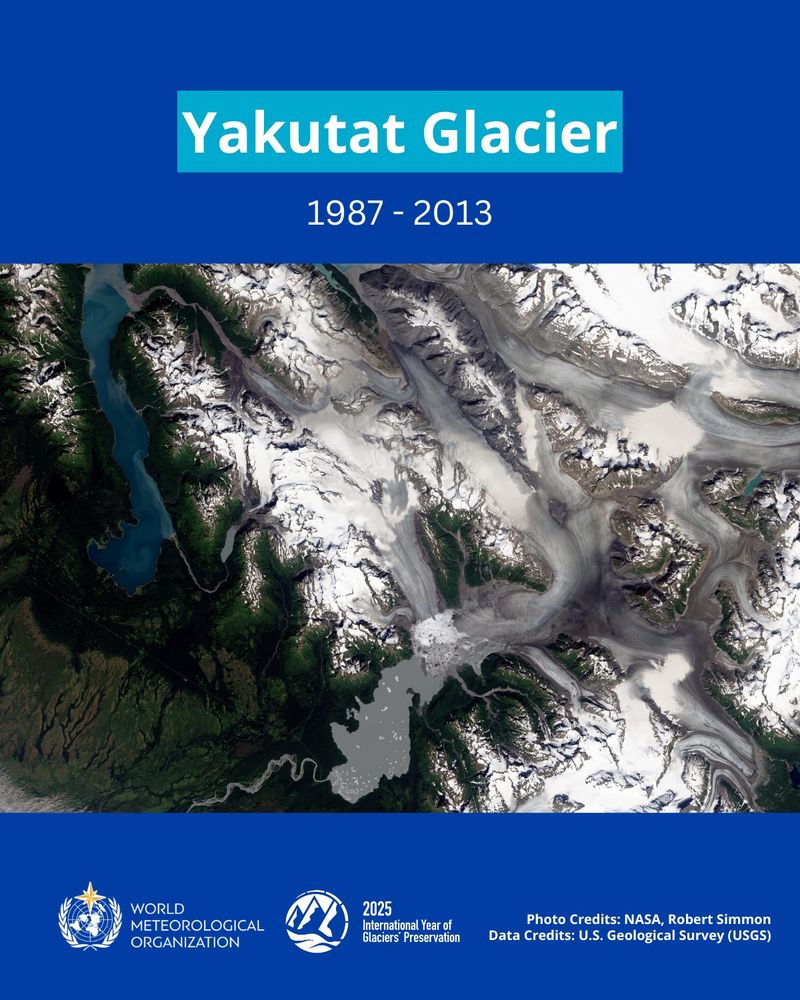
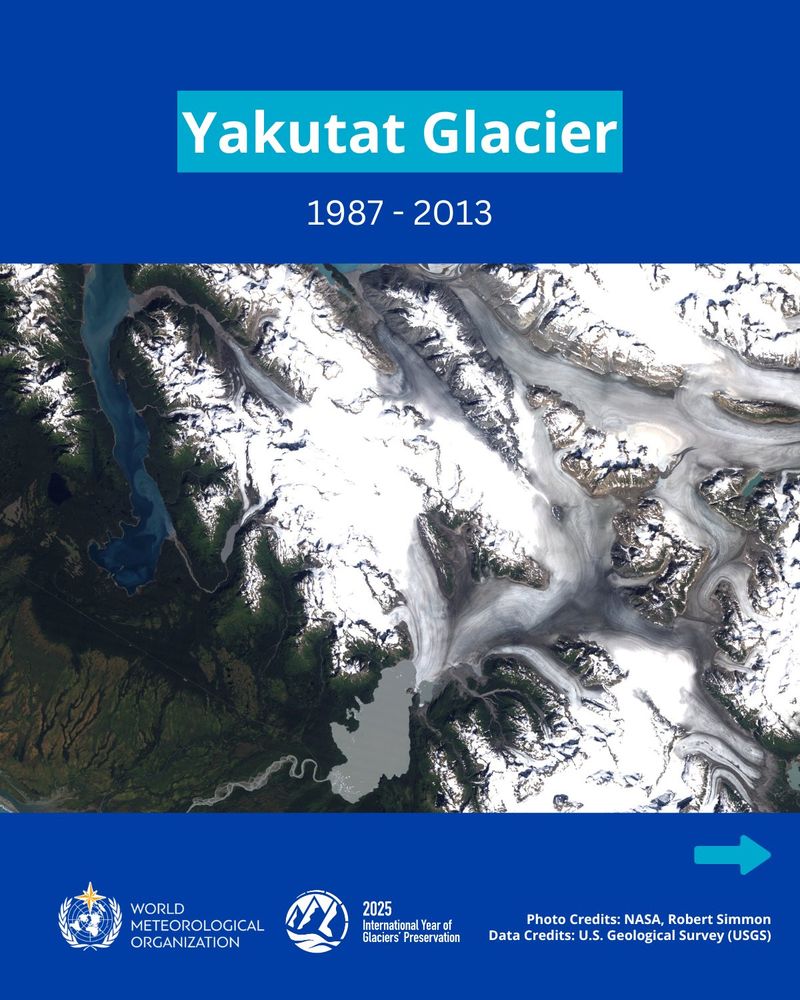
🏔️Yakutat Glacier is one of the fastest-retreating glaciers on Earth.

This "before and after" is a stark reminder that glaciers are sensitive indicators of climate change, and around the world, they are retreating due to rising temperatures.

#Glaciers2025
Reposted by Tim Osborn
eddywx.bsky.social
What a beauty... a terrible monstrous beauty... #StormAmy #Humberto from METEOSAT-12/ MTG water vapour 6.2micron channel: The dark area is dry, descending air. Where it forms the scorpion's tail in the final frame (dare I say "sting") is location of some of the most violent winds
Reposted by Tim Osborn
edhawkins.org
The Rainfall Observers

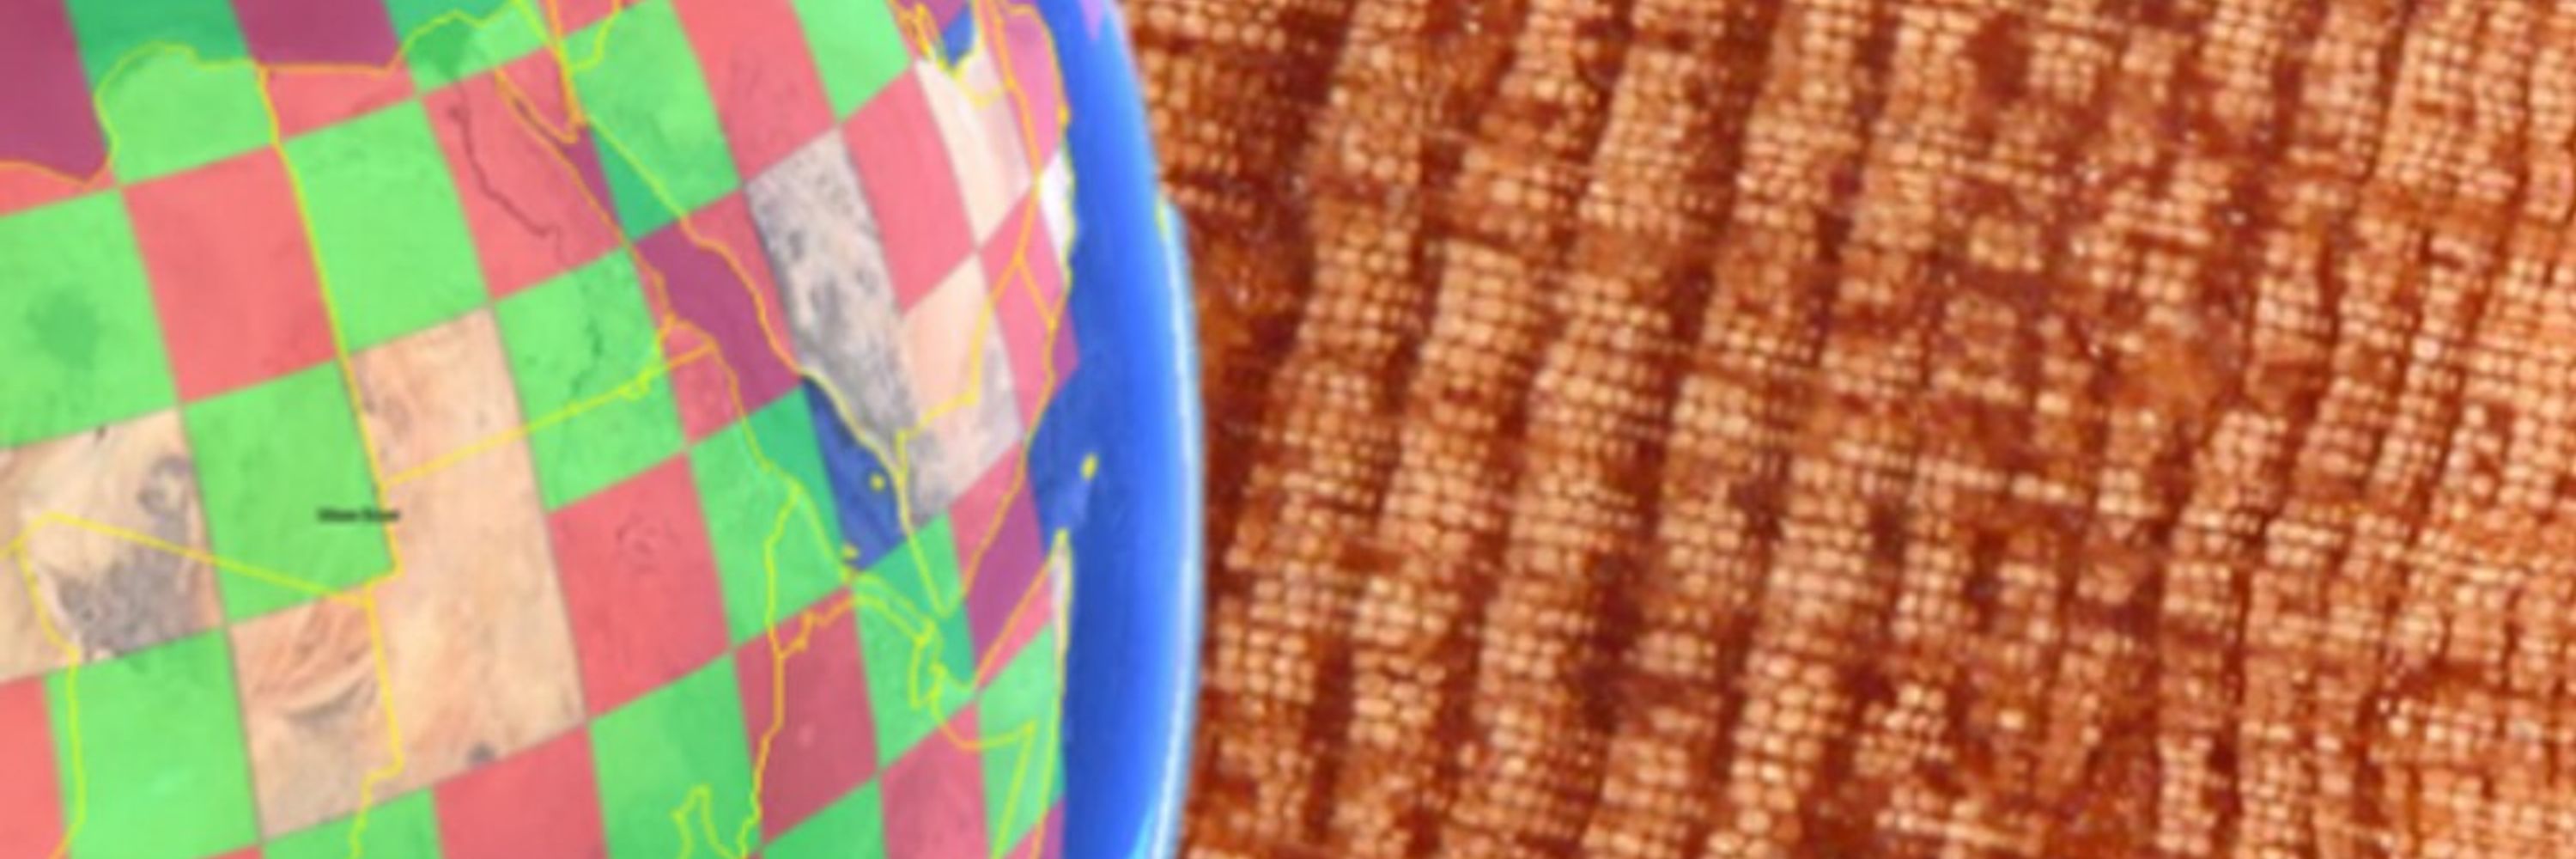
Over the past three centuries, thousands of people across the British & Irish Isles have recorded rainfall, often every day for decades. Here we recognise some of the individuals who made particularly important contributions.

rmets.onlinelibrary.wiley.com/doi/10.1002/...
The rainfall observers
Over the past three centuries, thousands of people across the British and Irish Isles have regularly recorded rainfall, often every day for decades. Their efforts allow us to reconstruct long-term tr...
rmets.onlinelibrary.wiley.com
Reposted by Tim Osborn
wxliz.bsky.social
Just a reminder that NWS is considered essential during a government shutdown. Meteorologists will still go to work, forecasts will still be made, watches and warnings will be issued, data will flow. We won’t be paid until the shutdown ends, but we’ll still protect life and property as always.
timosbornclim.bsky.social
Climate stripes by longitude? Here's mine from 2004.
Estimates temperature changes from 1400-1960 over the mid to high latitudes of the Northern Hemisphere as a function of longitude covering North America, Europe and Russia. From work by Tim Osborn and colleagues in 2004, based on records of tree-ring maximum latewood density.
Reposted by Tim Osborn
simonleewx.com
I'm a really big fan of these "storyline" approaches to uncertain forecasts – such a simple way to communicate quite a lot of detail and I think in a way that makes sense to many. Hope to see more of these on TV
petagna.bsky.social
The possible outcomes for the weather later this week..
Reposted by Tim Osborn
tyndallcentre.bsky.social
To celebrate its 25th anniversary, the Tyndall Centre has just hosted its largest ever climate conference on the UEA campus in Norwich, UK - ‘The Critical Decade for Climate Action':
Why Norwich continues to be at the heart of climate change research
www.edp24.co.uk
Reposted by Tim Osborn
caadcoalition.bsky.social
Spain has just announced it’s joining the Global Initiative for Information Integrity on Climate Change.

"Disinformation not only creates confusion and spreads fake news; in the context of the climate emergency, it also puts lives and property at risk. Climate misinformation kills"

buff.ly/cixOfB9
Pedro Sánchez anuncia que España se adherirá a la Iniciativa Global para la Integridad de la Información sobre Cambio Climático
Nueva York, miércoles, 24 de septiembre de 2025. El jefe del Ejecutivo, Pedro Sánchez, ha intervenido en el evento de alto nivel sobre Acción Climática, celebrado en la sala del Consejo de…
www.lamoncloa.gob.es
Reposted by Tim Osborn
timosbornclim.bsky.social
Thanks for the comment. Decision to use USHCN as a source predated my involvement and very likely made sense at the time, fitting with the CRUTEM approach. But, yes, it’s on the to-do list to move to a better option for the US data
Reposted by Tim Osborn
evayp.bsky.social
Beautiful thread about the function of terpenes for trees!
c0nc0rdance.bsky.social
Ponderosa pine smells like butterscotch.

Go ahead, sniff one the next time you're in the western US. Some say "vanilla", some say "oh no, my nose is covered in sap."

Let's talk about birds, butterscotch, forest fires, blue wood, & boring beetles.

But mostly this thread is about terpenes.
From a blog called "CreationsDawn", a photo of the author smelling a ponderosa pine.  The author wears a green cap, light blue-green shirt and red camel pack.  They are sniffing a tree with pine bark, with a sort of red-orange color.  More trees in the background.
Reposted by Tim Osborn
hausfath.bsky.social
In a UN speech today, President Trump said that "all of these [climate] predictions were wrong".

Back in 2019 I led a research effort to digitize old climate model projections and assess how well they did. Turns out they got future warming pretty spot on!
Reposted by Tim Osborn

stottpeter.bsky.social
The people I work with are not stupid people and our climate predictions of 30 years ago of global warming have proved to be accurate. Just saying. www.bbc.co.uk/news/live/cp...
Reposted by Tim Osborn
climatologist49.bsky.social
Hours of daylight throughout the year in the Northern Hemisphere.
timosbornclim.bsky.social
There is a US-specific issue for the current year to be aware of: bsky.app/profile/timo...
timosbornclim.bsky.social
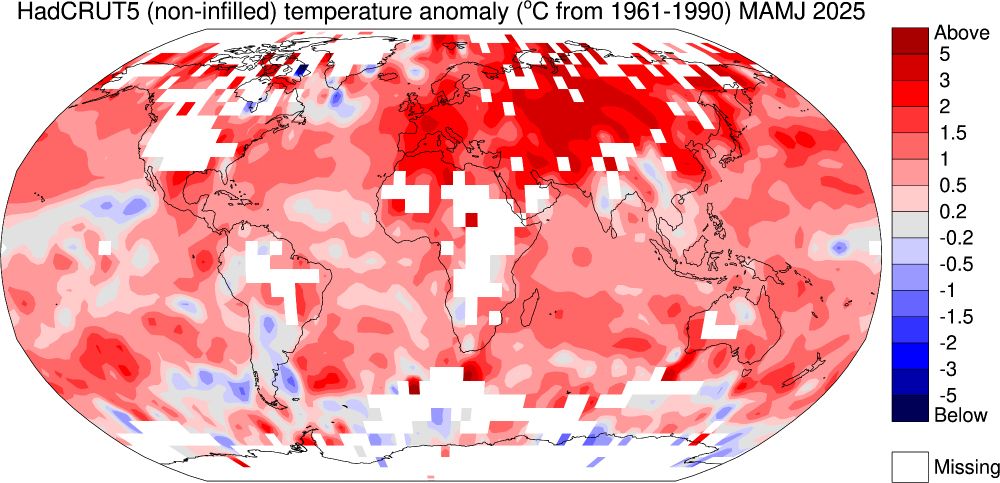
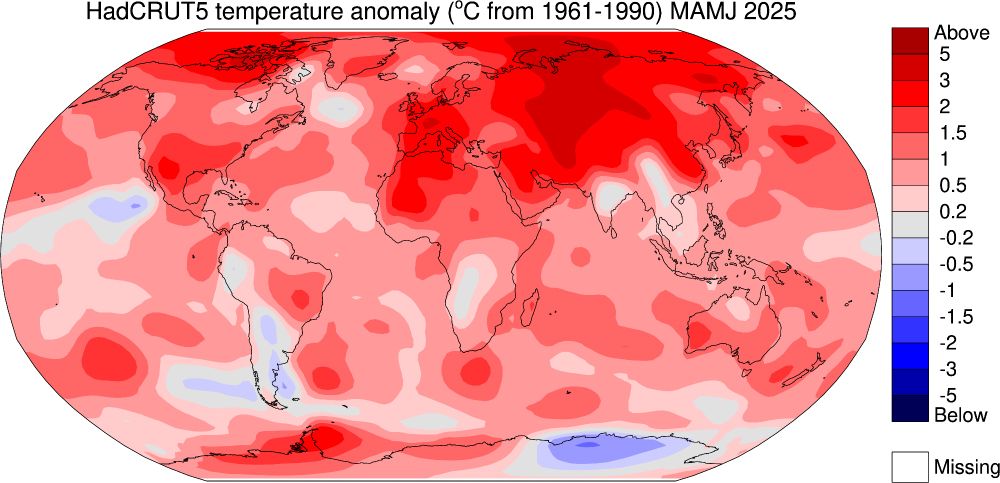
For regular monthly updates to CRUTEM (and hence to HadCRUT) we rely on monthly data provided by National Met Services via the WMO's CLIMAT system. Unusually, the USA data didn't yet make it into the CLIMAT data feed for Mar-Jun 2025. Note the USA-sized gap in the non-infilled version of HadCRUT:
timosbornclim.bsky.social
This doesn't mean that the US data are not available, just that they aren't in the specific data feed that CRUTEM/HadCRUT uses. Other global temperature datasets probably get them via other data feeds.
timosbornclim.bsky.social
For regular monthly updates to CRUTEM (and hence to HadCRUT) we rely on monthly data provided by National Met Services via the WMO's CLIMAT system. Unusually, the USA data didn't yet make it into the CLIMAT data feed for Mar-Jun 2025. Note the USA-sized gap in the non-infilled version of HadCRUT:
timosbornclim.bsky.social
Not sure about the US changes, though the different time series doesn't show such prominent changes as for China, so there must be some cancelling of +ve and -ve changes even though the difference map looks a bit blue overall in that region