


Neil Eriksson
@neileriksson.bsky.social
Interested in #climate change, the brain, trees, the outdoors, camping, space, technology, beer, food, roughly in that order. Software engineer. South African 🇿🇦 in the UK 🇬🇧.
315 ppm
@[email protected]
Was on Twitter as @neileriksson
315 ppm
@[email protected]
Was on Twitter as @neileriksson
Reposted by Neil Eriksson

The corruption is absolutely staggering. One big money donor after another receiving direct benefits in return. Trump didn’t drain any swamps, he created a giant sewer to roll around in daily. Great reporting. www.nytimes.com/interactive/...

December 22, 2025 at 1:25 PM
The corruption is absolutely staggering. One big money donor after another receiving direct benefits in return. Trump didn’t drain any swamps, he created a giant sewer to roll around in daily. Great reporting. www.nytimes.com/interactive/...
Reposted by Neil Eriksson

Let’s see what we can learn from temperature change in the next two years – mailchi.mp/caa/global-t...
Also available on Substack: jimehansen.substack.com/.../global-t....
Also available on Substack: jimehansen.substack.com/.../global-t....

December 18, 2025 at 2:26 PM
Let’s see what we can learn from temperature change in the next two years – mailchi.mp/caa/global-t...
Also available on Substack: jimehansen.substack.com/.../global-t....
Also available on Substack: jimehansen.substack.com/.../global-t....
Reposted by Neil Eriksson
This map shows the projection of changes in annual precipitation in South Africa at ~1.5°C of heating.
This is already playing out in real-time in December 2025.
Floods in KZN (iol.co.za/news/south...)
Drought in the WC (peterdutoit.com/knys...)
This is already playing out in real-time in December 2025.
Floods in KZN (iol.co.za/news/south...)
Drought in the WC (peterdutoit.com/knys...)

December 22, 2025 at 3:31 AM
This map shows the projection of changes in annual precipitation in South Africa at ~1.5°C of heating.
This is already playing out in real-time in December 2025.
Floods in KZN (iol.co.za/news/south...)
Drought in the WC (peterdutoit.com/knys...)
This is already playing out in real-time in December 2025.
Floods in KZN (iol.co.za/news/south...)
Drought in the WC (peterdutoit.com/knys...)
Reposted by Neil Eriksson
New analysis: The last German gas-heated homes face €4,000+ in annual extra costs by 2045 from rising grid fees.
Smart regulation can avoid this - our research on this thorny issue: www.sciencedirect.com/science/arti...
www.sciencedirect.com/science/arti...
Smart regulation can avoid this - our research on this thorny issue: www.sciencedirect.com/science/arti...
www.sciencedirect.com/science/arti...

December 11, 2025 at 11:51 AM
New analysis: The last German gas-heated homes face €4,000+ in annual extra costs by 2045 from rising grid fees.
Smart regulation can avoid this - our research on this thorny issue: www.sciencedirect.com/science/arti...
www.sciencedirect.com/science/arti...
Smart regulation can avoid this - our research on this thorny issue: www.sciencedirect.com/science/arti...
www.sciencedirect.com/science/arti...
Reposted by Neil Eriksson

It is intensely funny to me that tech bro CEOs on an annual salary of 15 petabillion dollars think data centres can go in space because it's very cold but actually they would get obscenely hot because heat won't radiate into the vacuum of space
taranis.ie/datacenters-...
taranis.ie/datacenters-...


December 10, 2025 at 9:49 PM
It is intensely funny to me that tech bro CEOs on an annual salary of 15 petabillion dollars think data centres can go in space because it's very cold but actually they would get obscenely hot because heat won't radiate into the vacuum of space
taranis.ie/datacenters-...
taranis.ie/datacenters-...
Reposted by Neil Eriksson

How the BBC upholds fossil fuel industry narratives, 09/12/2025: an article about a battery storage project featuring one (1) person objecting to the scheme. The opinion is presented as indicative of popular opposition. No other viewpoint is offered.

December 10, 2025 at 10:58 AM
How the BBC upholds fossil fuel industry narratives, 09/12/2025: an article about a battery storage project featuring one (1) person objecting to the scheme. The opinion is presented as indicative of popular opposition. No other viewpoint is offered.
Reposted by Neil Eriksson
🌍🌡️ INSIGHT 🌡️🌍
🌱 "Adaptation of seeds to climate change is promoted by the mother plant". 🌱
Steven Penfield highlights this research recently published in JXB by Fernández Farnocchia et al.
Insight 🔗 doi.org/10.1093/jxb/...
Research 🔗 doi.org/10.1093/jxb/...
#PlantScience 🧪
🌱 "Adaptation of seeds to climate change is promoted by the mother plant". 🌱
Steven Penfield highlights this research recently published in JXB by Fernández Farnocchia et al.
Insight 🔗 doi.org/10.1093/jxb/...
Research 🔗 doi.org/10.1093/jxb/...
#PlantScience 🧪

December 9, 2025 at 7:01 PM
🌍🌡️ INSIGHT 🌡️🌍
🌱 "Adaptation of seeds to climate change is promoted by the mother plant". 🌱
Steven Penfield highlights this research recently published in JXB by Fernández Farnocchia et al.
Insight 🔗 doi.org/10.1093/jxb/...
Research 🔗 doi.org/10.1093/jxb/...
#PlantScience 🧪
🌱 "Adaptation of seeds to climate change is promoted by the mother plant". 🌱
Steven Penfield highlights this research recently published in JXB by Fernández Farnocchia et al.
Insight 🔗 doi.org/10.1093/jxb/...
Research 🔗 doi.org/10.1093/jxb/...
#PlantScience 🧪
Reposted by Neil Eriksson
Arctic in Disarray!!
An Extremely Extreme pattern builds this weekend. Surface Temps as much as 60°F below normal in Canada (lows -60°F) and 70°F above normal (Highs 40°F in Arctic Circle) in Russia… 1/
An Extremely Extreme pattern builds this weekend. Surface Temps as much as 60°F below normal in Canada (lows -60°F) and 70°F above normal (Highs 40°F in Arctic Circle) in Russia… 1/

December 8, 2025 at 11:05 PM
Arctic in Disarray!!
An Extremely Extreme pattern builds this weekend. Surface Temps as much as 60°F below normal in Canada (lows -60°F) and 70°F above normal (Highs 40°F in Arctic Circle) in Russia… 1/
An Extremely Extreme pattern builds this weekend. Surface Temps as much as 60°F below normal in Canada (lows -60°F) and 70°F above normal (Highs 40°F in Arctic Circle) in Russia… 1/
This is so in touch! I know I’ve often thought “if this airport just had some pull-up bars, I’d be having the time of my life”! Who hasn’t??

Duffy on what he's doing to improve the airport experience for travelers: "Maybe I want a workout area where people might get some blood flowing doing some pull ups or step ups in the airport."
December 8, 2025 at 10:57 PM
This is so in touch! I know I’ve often thought “if this airport just had some pull-up bars, I’d be having the time of my life”! Who hasn’t??
Reposted by Neil Eriksson
Recent studies in the field I work in suggest it is probably already too late save most of the West Antarctic Ice Sheet, which means we will have to find ways to adapt to committed sea-level rise of more than 3 metres over the next few centuries.
December 7, 2025 at 8:51 AM
Recent studies in the field I work in suggest it is probably already too late save most of the West Antarctic Ice Sheet, which means we will have to find ways to adapt to committed sea-level rise of more than 3 metres over the next few centuries.
Reposted by Neil Eriksson

"Temperatures are rising at twice the global average, with intense heatwaves that are pushing society to the limits.
Human health, ecosystems & economies can’t cope with extended spells of more than 50 °C – it is simply too hot to handle" - @wmo-global.bsky.social
#MENA
wmo.int/news/media-c...
Human health, ecosystems & economies can’t cope with extended spells of more than 50 °C – it is simply too hot to handle" - @wmo-global.bsky.social
#MENA
wmo.int/news/media-c...

December 5, 2025 at 3:09 AM
"Temperatures are rising at twice the global average, with intense heatwaves that are pushing society to the limits.
Human health, ecosystems & economies can’t cope with extended spells of more than 50 °C – it is simply too hot to handle" - @wmo-global.bsky.social
#MENA
wmo.int/news/media-c...
Human health, ecosystems & economies can’t cope with extended spells of more than 50 °C – it is simply too hot to handle" - @wmo-global.bsky.social
#MENA
wmo.int/news/media-c...
Reposted by Neil Eriksson

It’s Friday. May I be blunt? F*ck this. www.bbc.com/news/article...

Over a third of animals lost in test deep sea mining - scientists
The findings contribute to a controversial debate that pits green technology against the environment.
www.bbc.com
December 5, 2025 at 9:23 AM
It’s Friday. May I be blunt? F*ck this. www.bbc.com/news/article...
Reposted by Neil Eriksson
This is how we all die.

December 5, 2025 at 5:07 AM
This is how we all die.
Reposted by Neil Eriksson
1. Some good news at last. This week’s column is about the amazing thing a couple of us stumbled into three years ago, which we’ve now developed into a global research programme. It doesn’t change everything, of course, but it could help change quite a lot. + 🧵 www.theguardian.com/commentisfre...

Over a pint in Oxford, we may have stumbled upon the holy grail of agriculture | George Monbiot
I knew that a revolution in our understanding of soil could change the world. Then came a eureka moment – and the birth of the Earth Rover Program, says Guardian columnist George Monbiot
www.theguardian.com
December 5, 2025 at 6:55 AM
1. Some good news at last. This week’s column is about the amazing thing a couple of us stumbled into three years ago, which we’ve now developed into a global research programme. It doesn’t change everything, of course, but it could help change quite a lot. + 🧵 www.theguardian.com/commentisfre...
Reposted by Neil Eriksson
While the yearly minimum for Arctic sea-ice volume has been relatively stable for the last 15 years, this year saw a new record low for Arctic sea-ice thickness. By a lot.
What's going to happen in 2026? The Climate 8-ball is skating on thin ice.
What's going to happen in 2026? The Climate 8-ball is skating on thin ice.

December 4, 2025 at 2:03 PM
While the yearly minimum for Arctic sea-ice volume has been relatively stable for the last 15 years, this year saw a new record low for Arctic sea-ice thickness. By a lot.
What's going to happen in 2026? The Climate 8-ball is skating on thin ice.
What's going to happen in 2026? The Climate 8-ball is skating on thin ice.
Reposted by Neil Eriksson
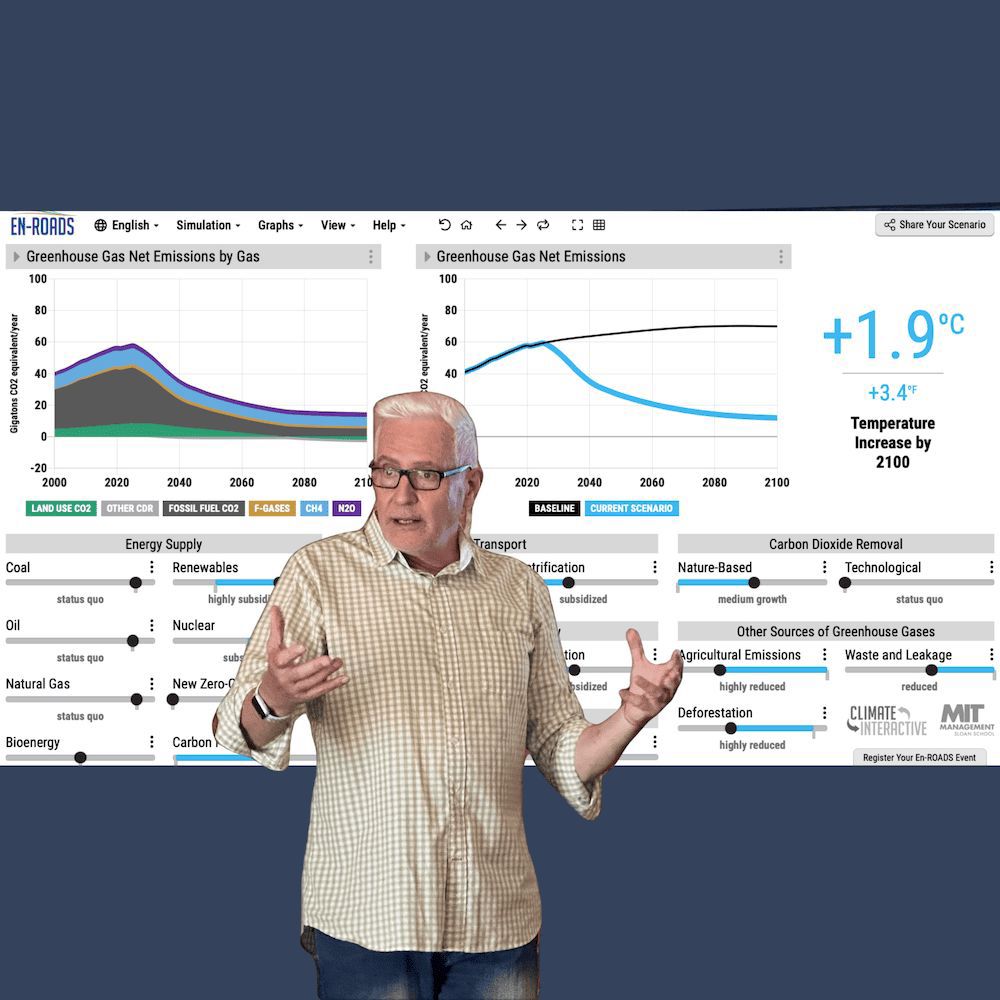
Please watch this important new video from Youtube channel “Just Have a Think”.

This is not the video I had planned to make.
YouTube video by Just Have a Think
youtu.be
November 30, 2025 at 7:38 PM
Please watch this important new video from Youtube channel “Just Have a Think”.
Reposted by Neil Eriksson
The UK’s first National Emergency Briefing on the #Climate & Nature crisis was held on the 27th November.
Sign an open letter to Keir Starmer on the climate crisis.
www.nebriefing.org/open-letter-...
Sign an open letter to Keir Starmer on the climate crisis.
www.nebriefing.org/open-letter-...
December 1, 2025 at 10:22 AM
The UK’s first National Emergency Briefing on the #Climate & Nature crisis was held on the 27th November.
Sign an open letter to Keir Starmer on the climate crisis.
www.nebriefing.org/open-letter-...
Sign an open letter to Keir Starmer on the climate crisis.
www.nebriefing.org/open-letter-...
Reposted by Neil Eriksson

Watch all of this, sign the letter and ‘Just Have a think!’
Even if you’re too old (like me) to worry about it, think about your kids, their kids and beyond. I don’t have any kids but I have nephews and nieces and their kids who I care about. Do it. It’s important to have a voice.
Even if you’re too old (like me) to worry about it, think about your kids, their kids and beyond. I don’t have any kids but I have nephews and nieces and their kids who I care about. Do it. It’s important to have a voice.
Please watch this important new video from Youtube channel “Just Have a Think”.
This is not the video I had planned to make.
YouTube video by Just Have a Think
youtu.be
December 1, 2025 at 9:03 AM
Watch all of this, sign the letter and ‘Just Have a think!’
Even if you’re too old (like me) to worry about it, think about your kids, their kids and beyond. I don’t have any kids but I have nephews and nieces and their kids who I care about. Do it. It’s important to have a voice.
Even if you’re too old (like me) to worry about it, think about your kids, their kids and beyond. I don’t have any kids but I have nephews and nieces and their kids who I care about. Do it. It’s important to have a voice.
Reposted by Neil Eriksson

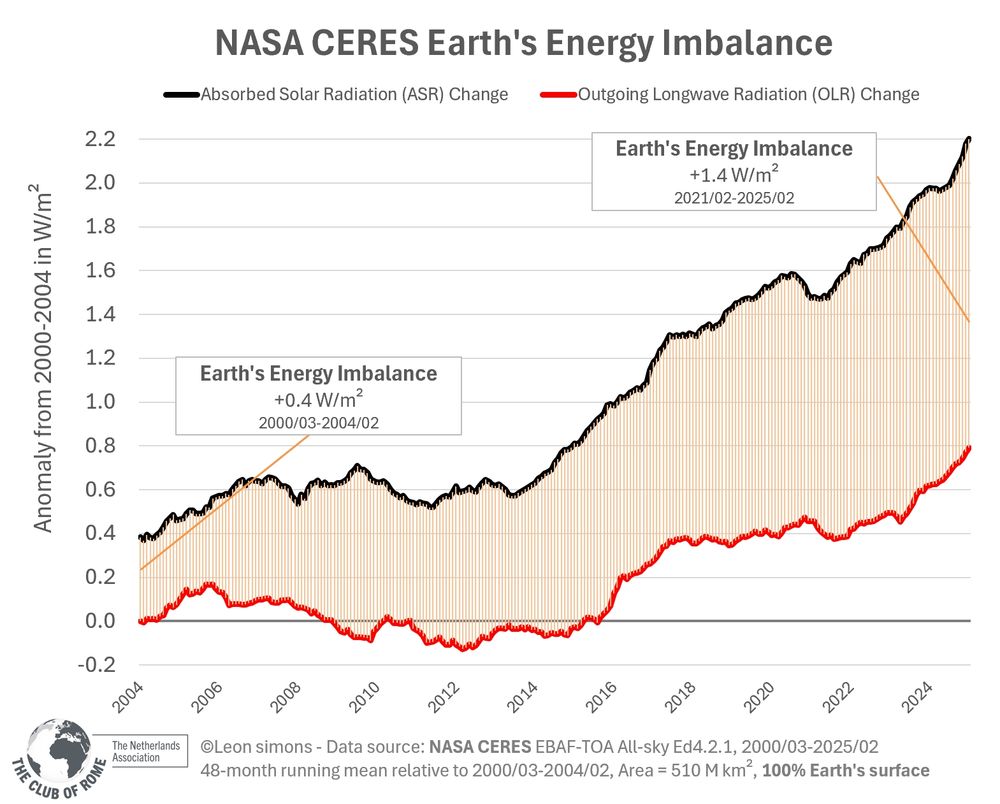
No one should be surprised when a planet that accumulates heat more than twice as fast starts to see temperatures go up more than twice as fast.
This isn't rocket science, but we do need more of these NASA satellites. 🌍🛰
To keep us from going blind.
bsky.app/profile/leon...
This isn't rocket science, but we do need more of these NASA satellites. 🌍🛰
To keep us from going blind.
bsky.app/profile/leon...
June 6, 2025 at 9:53 PM
No one should be surprised when a planet that accumulates heat more than twice as fast starts to see temperatures go up more than twice as fast.
This isn't rocket science, but we do need more of these NASA satellites. 🌍🛰
To keep us from going blind.
bsky.app/profile/leon...
This isn't rocket science, but we do need more of these NASA satellites. 🌍🛰
To keep us from going blind.
bsky.app/profile/leon...
Reposted by Neil Eriksson

It’s no accident the ladder climbers & fake smart careerist class occupying our government, mass media, boardrooms etc aren’t capable of understanding/responding to what Hansen is theorizing here.
A proper response would change the world within weeks. And that is the last thing big capital wants.
A proper response would change the world within weeks. And that is the last thing big capital wants.
Warning! This colorful chart is censored by IPCC - mailchi.mp/caa/warning-...
Also available on Substack: jimehansen.substack.com/p/warning-th...
Also available on Substack: jimehansen.substack.com/p/warning-th...

November 23, 2025 at 9:53 AM
It’s no accident the ladder climbers & fake smart careerist class occupying our government, mass media, boardrooms etc aren’t capable of understanding/responding to what Hansen is theorizing here.
A proper response would change the world within weeks. And that is the last thing big capital wants.
A proper response would change the world within weeks. And that is the last thing big capital wants.
Reposted by Neil Eriksson
Finland’s President Alexander Stubb @alexstubb.bsky.social made an excellent short 3 minute speech at the G20 summit in South Africa about multilateralism and urging nations to cooperate fairly following the rules to achieve sustainability.
Worth watching:
Worth watching:

Finland’s Alexander Stubb Calls for Rules-Based Approach to Global Wars in First G20 Speech | AC1B
YouTube video by DRM News
youtu.be
November 23, 2025 at 6:56 PM
Finland’s President Alexander Stubb @alexstubb.bsky.social made an excellent short 3 minute speech at the G20 summit in South Africa about multilateralism and urging nations to cooperate fairly following the rules to achieve sustainability.
Worth watching:
Worth watching:
Reposted by Neil Eriksson
The atmospheric CO₂ growth rate was off the chart in 2024!

November 14, 2025 at 7:00 PM
The atmospheric CO₂ growth rate was off the chart in 2024!
Reposted by Neil Eriksson

Trump and RFK Jr's CDC just added a page that is full of disinformation about vaccines and autism.

November 20, 2025 at 5:28 AM
Trump and RFK Jr's CDC just added a page that is full of disinformation about vaccines and autism.
Reposted by Neil Eriksson
1,019 glaciers have disappeared since 1973 in Switzerland! ✝️
1st nationwide assessment of vanished glaciers:
>40% of the glaciers inventoried in 1973
~13% (47±3 km²) of total glacier area loss! 🧊🔥
But, as it is based on the latest inventory (from 2016), the actual figures are far much higher! 📈 😰
1st nationwide assessment of vanished glaciers:
>40% of the glaciers inventoried in 1973
~13% (47±3 km²) of total glacier area loss! 🧊🔥
But, as it is based on the latest inventory (from 2016), the actual figures are far much higher! 📈 😰

November 19, 2025 at 12:05 PM
1,019 glaciers have disappeared since 1973 in Switzerland! ✝️
1st nationwide assessment of vanished glaciers:
>40% of the glaciers inventoried in 1973
~13% (47±3 km²) of total glacier area loss! 🧊🔥
But, as it is based on the latest inventory (from 2016), the actual figures are far much higher! 📈 😰
1st nationwide assessment of vanished glaciers:
>40% of the glaciers inventoried in 1973
~13% (47±3 km²) of total glacier area loss! 🧊🔥
But, as it is based on the latest inventory (from 2016), the actual figures are far much higher! 📈 😰
Reposted by Neil Eriksson

A view of this year's extreme sea surface temperatures and recent warming across the North Pacific... 🌊
This graph shows the average for a band across the midlatitudes for every average January-October period from 1854-2025 using ERSSTv5 data.
This graph shows the average for a band across the midlatitudes for every average January-October period from 1854-2025 using ERSSTv5 data.

November 19, 2025 at 1:28 AM
A view of this year's extreme sea surface temperatures and recent warming across the North Pacific... 🌊
This graph shows the average for a band across the midlatitudes for every average January-October period from 1854-2025 using ERSSTv5 data.
This graph shows the average for a band across the midlatitudes for every average January-October period from 1854-2025 using ERSSTv5 data.