


While I love the #30DayMapChallenge, I couldn't fit it in my schedule. I like the idea of making for-fun-maps based on fixed themes. I created a list of 52 subjects for myself to use over the course of this year to create maps that I can share. You can find it on 52maps.org and join me. #52maps

52 weeks of Map-Making
A year-long creative map-making inspired by 52 weekly subjects: explore a new cartography theme each week and share your maps using #52maps.
52maps.org
January 6, 2026 at 4:57 PM
While I love the #30DayMapChallenge, I couldn't fit it in my schedule. I like the idea of making for-fun-maps based on fixed themes. I created a list of 52 subjects for myself to use over the course of this year to create maps that I can share. You can find it on 52maps.org and join me. #52maps
#30DayMapChallenge | Day 14 OSM | This map challenges the idea that streets belong to cars, even so-called sharrows that still feel unsafe. Using an inverted speed-limit hierarchy, fast roads fade. Bold bike infrastructure reveals how broken and fragmented the biking network is.

December 29, 2025 at 6:51 PM
#30DayMapChallenge | Day 14 OSM | This map challenges the idea that streets belong to cars, even so-called sharrows that still feel unsafe. Using an inverted speed-limit hierarchy, fast roads fade. Bold bike infrastructure reveals how broken and fragmented the biking network is.

The German “Pig Belt” is a highly specialised pig farming region in parts of Lower Saxony and North Rhine-Westphalia, accounting for around 60% of the country's pig population.
#30DayMapChallenge | Day 16 - Cell #rstats #ggplot2
#30DayMapChallenge | Day 16 - Cell #rstats #ggplot2

December 22, 2025 at 3:33 PM
The German “Pig Belt” is a highly specialised pig farming region in parts of Lower Saxony and North Rhine-Westphalia, accounting for around 60% of the country's pig population.
#30DayMapChallenge | Day 16 - Cell #rstats #ggplot2
#30DayMapChallenge | Day 16 - Cell #rstats #ggplot2

We created a lot of quick maps during the #30DayMapChallenge! When I was a GIS environmental consultant, I created templates for most of my maps. There was very little time for cartographic flair, so I did what I could via trial and error. This was before I took any carto classes.
December 22, 2025 at 8:56 PM
We created a lot of quick maps during the #30DayMapChallenge! When I was a GIS environmental consultant, I created templates for most of my maps. There was very little time for cartographic flair, so I did what I could via trial and error. This was before I took any carto classes.
#30DayMapChallenge | Day 26 Transport | After Atlanta, I made another #LEGO transit map of #Madison Metro Rapid BRT. Smooth lines failed on diagonal routes, so I returned to a pixelated version. I spent really long time designing the capitol building, and hope it serves as the finishing touch! 😊


December 21, 2025 at 6:43 AM
#30DayMapChallenge | Day 26 Transport | After Atlanta, I made another #LEGO transit map of #Madison Metro Rapid BRT. Smooth lines failed on diagonal routes, so I returned to a pixelated version. I spent really long time designing the capitol building, and hope it serves as the finishing touch! 😊

I'm really looking forward to chatting with @visualisingdata.com alongside @ansgarw.bsky.social all about the #30DayMapChallenge!
#RStats #DataViz
#RStats #DataViz

Then S6E6 will be a #30DayMapChallenge special with two fantastic guests, @nrennie.bsky.social and @ansgarw.bsky.social, joining me to explore some of their amazing map submissions for this brilliant and unique challenge, which was held during November.
visualisingdata.com/podcast/
visualisingdata.com/podcast/

Podcast - Data Viz Excellence, Everywhere
THE ‘EXPLORE EXPLAIN’ PODCAST & VIDEO SERIES Explore Explain is a long-form podcast and video series hosted by Andy Kirk that goes deep into the behind-the-scenes stories of data visualisation projec...
visualisingdata.com
December 18, 2025 at 10:05 PM
I'm really looking forward to chatting with @visualisingdata.com alongside @ansgarw.bsky.social all about the #30DayMapChallenge!
#RStats #DataViz
#RStats #DataViz
The #30DayMapChallenge is a wrap! I made a map quilt of my favorite Rhode Island maps from the challenge. I had to resize a few of them to get them all to line up. Had I planned this in advance, I would have alternated between light and dark maps.
#cartography
#cartography

December 10, 2025 at 5:28 PM
The #30DayMapChallenge is a wrap! I made a map quilt of my favorite Rhode Island maps from the challenge. I had to resize a few of them to get them all to line up. Had I planned this in advance, I would have alternated between light and dark maps.
#cartography
#cartography
#30DayMapChallenge | Day 22 Natural Earth
Based on my earlier #chromostereopsis globe, I made another #stereogram centered on the Western Hemisphere. Use the magic-eye parallel view at phone-screen size to see the 3D effect. It can be very tough, so don't force it since it may strain your eyes🫨
Based on my earlier #chromostereopsis globe, I made another #stereogram centered on the Western Hemisphere. Use the magic-eye parallel view at phone-screen size to see the 3D effect. It can be very tough, so don't force it since it may strain your eyes🫨

December 10, 2025 at 6:08 AM
#30DayMapChallenge | Day 22 Natural Earth
Based on my earlier #chromostereopsis globe, I made another #stereogram centered on the Western Hemisphere. Use the magic-eye parallel view at phone-screen size to see the 3D effect. It can be very tough, so don't force it since it may strain your eyes🫨
Based on my earlier #chromostereopsis globe, I made another #stereogram centered on the Western Hemisphere. Use the magic-eye parallel view at phone-screen size to see the 3D effect. It can be very tough, so don't force it since it may strain your eyes🫨

November is over, but we still have some #30DayMapChallenge entries to share! And for our transport-themed day 26 map, MBTA data analyst Joe Hilleary takes us on a ride back in time: he shows current bus routes in Greater Boston by the earliest known year in which a direct percursor route ran a bus.

December 9, 2025 at 5:01 PM
November is over, but we still have some #30DayMapChallenge entries to share! And for our transport-themed day 26 map, MBTA data analyst Joe Hilleary takes us on a ride back in time: he shows current bus routes in Greater Boston by the earliest known year in which a direct percursor route ran a bus.

This year's #30DayMapChallenge was a bit challenging due to my activities in November: 9 concerts, teaching, trips to Algeria and Morocco... Read the new blog on the #qwast website on how I made each map. https://www.qwast-gis.com/l/30daymapchallenge-2025/

December 8, 2025 at 8:48 AM
This year's #30DayMapChallenge was a bit challenging due to my activities in November: 9 concerts, teaching, trips to Algeria and Morocco... Read the new blog on the #qwast website on how I made each map. https://www.qwast-gis.com/l/30daymapchallenge-2025/
#30DayMapChallenge | Day 19 Projections & 22 Natural Earth | I created a fun “shaking” earth graphic based on #chromostereopsis, a color-based depth illusion in which red and blue light fall on slightly different spots in the eyes, creating a horizontal offset that our brain interprets as depth.🌐👀

December 7, 2025 at 4:54 AM
#30DayMapChallenge | Day 19 Projections & 22 Natural Earth | I created a fun “shaking” earth graphic based on #chromostereopsis, a color-based depth illusion in which red and blue light fall on slightly different spots in the eyes, creating a horizontal offset that our brain interprets as depth.🌐👀
#30DayMapChallenge Day 30: Makeover 🏔️
This is it! Thirty maps in 30 (ahem… 35) days.
For today’s prompt I revisited a map I started in the 2024 challenge, when I only managed to complete the coastline. This time, I gave it a proper makeover using the 1:250k LINZ contours.
This is it! Thirty maps in 30 (ahem… 35) days.
For today’s prompt I revisited a map I started in the 2024 challenge, when I only managed to complete the coastline. This time, I gave it a proper makeover using the 1:250k LINZ contours.
December 6, 2025 at 8:35 AM
#30DayMapChallenge Day 30: Makeover 🏔️
This is it! Thirty maps in 30 (ahem… 35) days.
For today’s prompt I revisited a map I started in the 2024 challenge, when I only managed to complete the coastline. This time, I gave it a proper makeover using the 1:250k LINZ contours.
This is it! Thirty maps in 30 (ahem… 35) days.
For today’s prompt I revisited a map I started in the 2024 challenge, when I only managed to complete the coastline. This time, I gave it a proper makeover using the 1:250k LINZ contours.
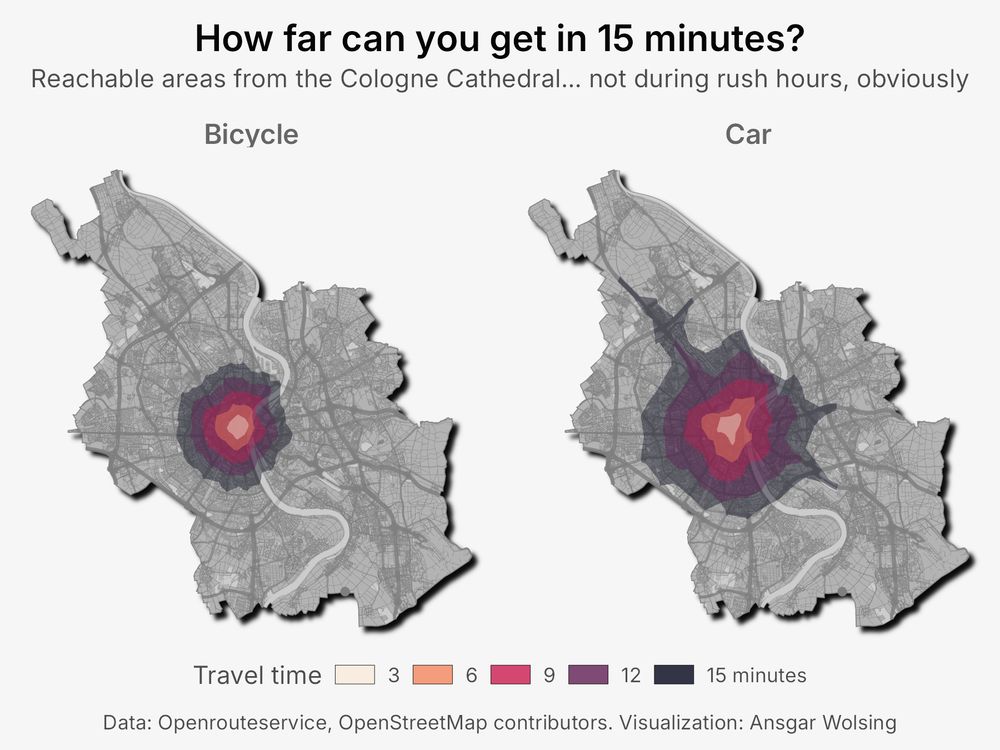
How far can you get in 15 minutes by bike and by car when you start at the Cologne Cathedral?
#30DayMapChallenge | Day 07 - Accessibility #rstats #ggplot2
#30DayMapChallenge | Day 07 - Accessibility #rstats #ggplot2
December 4, 2025 at 12:22 PM
How far can you get in 15 minutes by bike and by car when you start at the Cologne Cathedral?
#30DayMapChallenge | Day 07 - Accessibility #rstats #ggplot2
#30DayMapChallenge | Day 07 - Accessibility #rstats #ggplot2
#30DayMapChallenge Day 29: Raster 🎨
Today I produced a “paint by numbers” raster grid of soil moisture based on NASA’s SMAP data. Shout out if you’d like a copy to “paint” yourself.
Soil moisture is a key piece of the flood puzzle: when soils are already saturated, floods can escalate fast.
Today I produced a “paint by numbers” raster grid of soil moisture based on NASA’s SMAP data. Shout out if you’d like a copy to “paint” yourself.
Soil moisture is a key piece of the flood puzzle: when soils are already saturated, floods can escalate fast.
December 4, 2025 at 10:04 AM
#30DayMapChallenge Day 29: Raster 🎨
Today I produced a “paint by numbers” raster grid of soil moisture based on NASA’s SMAP data. Shout out if you’d like a copy to “paint” yourself.
Soil moisture is a key piece of the flood puzzle: when soils are already saturated, floods can escalate fast.
Today I produced a “paint by numbers” raster grid of soil moisture based on NASA’s SMAP data. Shout out if you’d like a copy to “paint” yourself.
Soil moisture is a key piece of the flood puzzle: when soils are already saturated, floods can escalate fast.

I wanted to do a lot more 😭 but November is over and I created maps for 12 days out of #30DayMapChallenge, like last year.
Gosh, I ♥️ maps 🗺️
#dataviz #maps
Gosh, I ♥️ maps 🗺️
#dataviz #maps


December 3, 2025 at 6:37 PM
I wanted to do a lot more 😭 but November is over and I created maps for 12 days out of #30DayMapChallenge, like last year.
Gosh, I ♥️ maps 🗺️
#dataviz #maps
Gosh, I ♥️ maps 🗺️
#dataviz #maps

The final installment of my #30DayMapChallenge #MapoftheWeek #GulfofMexico #gulfofmexico4ever mapoftheweek.substack.com/p/30-day-map...

December 3, 2025 at 2:29 PM
The final installment of my #30DayMapChallenge #MapoftheWeek #GulfofMexico #gulfofmexico4ever mapoftheweek.substack.com/p/30-day-map...
#30DayMapChallenge Day 28 Black ⚫
For today’s prompt I worked entirely in black, letting texture and material determine the map’s form. Three layers come together to depict the buildings, roads and background of Te Herenga Waka Victoria University of Wellington’s Kelburn campus.
For today’s prompt I worked entirely in black, letting texture and material determine the map’s form. Three layers come together to depict the buildings, roads and background of Te Herenga Waka Victoria University of Wellington’s Kelburn campus.
December 3, 2025 at 10:30 AM
#30DayMapChallenge Day 28 Black ⚫
For today’s prompt I worked entirely in black, letting texture and material determine the map’s form. Three layers come together to depict the buildings, roads and background of Te Herenga Waka Victoria University of Wellington’s Kelburn campus.
For today’s prompt I worked entirely in black, letting texture and material determine the map’s form. Three layers come together to depict the buildings, roads and background of Te Herenga Waka Victoria University of Wellington’s Kelburn campus.
#30DayMapChallenge | Day 24 Places and their Names | Latest map for public history project #Shanghai Dérive 魔都漂移 #CityWalk. This chapter traces the “Lone Island” in years 1937–1941, revisiting key resistance plates through on-site walks. More details: mp.weixin.qq.com/s/I09Hb52YtA....


December 3, 2025 at 4:52 AM
#30DayMapChallenge | Day 24 Places and their Names | Latest map for public history project #Shanghai Dérive 魔都漂移 #CityWalk. This chapter traces the “Lone Island” in years 1937–1941, revisiting key resistance plates through on-site walks. More details: mp.weixin.qq.com/s/I09Hb52YtA....

absolutely unhinged inspiring #30dayMapChallenge videos by @wendyshijia.bsky.social :
"I painted a ceramic plate using underglaze pigments and then had it 𝗸𝗶𝗹𝗻-𝗳𝗶𝗿𝗲𝗱 ... inspired by the Korean 𝘊𝘩𝘦𝘰𝘯𝘩𝘢𝘥𝘰, a traditional circular world map that blends known geography with imagined realms."
1/2 ...
"I painted a ceramic plate using underglaze pigments and then had it 𝗸𝗶𝗹𝗻-𝗳𝗶𝗿𝗲𝗱 ... inspired by the Korean 𝘊𝘩𝘦𝘰𝘯𝘩𝘢𝘥𝘰, a traditional circular world map that blends known geography with imagined realms."
1/2 ...
December 2, 2025 at 10:11 PM
absolutely unhinged inspiring #30dayMapChallenge videos by @wendyshijia.bsky.social :
"I painted a ceramic plate using underglaze pigments and then had it 𝗸𝗶𝗹𝗻-𝗳𝗶𝗿𝗲𝗱 ... inspired by the Korean 𝘊𝘩𝘦𝘰𝘯𝘩𝘢𝘥𝘰, a traditional circular world map that blends known geography with imagined realms."
1/2 ...
"I painted a ceramic plate using underglaze pigments and then had it 𝗸𝗶𝗹𝗻-𝗳𝗶𝗿𝗲𝗱 ... inspired by the Korean 𝘊𝘩𝘦𝘰𝘯𝘩𝘢𝘥𝘰, a traditional circular world map that blends known geography with imagined realms."
1/2 ...
One of the many reasons I struggled to finish the #30DayMapChallenge was because we had to go pick up our newest family member, name still TBD. He's very nervous but we're working on it.

December 2, 2025 at 4:39 PM
One of the many reasons I struggled to finish the #30DayMapChallenge was because we had to go pick up our newest family member, name still TBD. He's very nervous but we're working on it.
I tracked my runs with Strava. 🏃
Here’s a fun animation of my usual track. Speed not to scale. 😅
Exported on track from Strava as a GPX file and merged it with the activities data. Map and animation done in R with {ggplot2} and {gganimate}.
#30DayMapChallenge | Day 04 - My data #ggplot2
Here’s a fun animation of my usual track. Speed not to scale. 😅
Exported on track from Strava as a GPX file and merged it with the activities data. Map and animation done in R with {ggplot2} and {gganimate}.
#30DayMapChallenge | Day 04 - My data #ggplot2
December 2, 2025 at 8:03 PM
I tracked my runs with Strava. 🏃
Here’s a fun animation of my usual track. Speed not to scale. 😅
Exported on track from Strava as a GPX file and merged it with the activities data. Map and animation done in R with {ggplot2} and {gganimate}.
#30DayMapChallenge | Day 04 - My data #ggplot2
Here’s a fun animation of my usual track. Speed not to scale. 😅
Exported on track from Strava as a GPX file and merged it with the activities data. Map and animation done in R with {ggplot2} and {gganimate}.
#30DayMapChallenge | Day 04 - My data #ggplot2

Check out the hashtag #30DayMapChallenge

Day 27 #30DayMapChallenge - Venezuela's Territorial Waters
With threats of American military action against Venezuela, here's a map of Venezuelan territorial waters. At least one US warship is said to have recently entered the exclusive economic zone and detained a fishing vessel.
#rstats #dataviz
With threats of American military action against Venezuela, here's a map of Venezuelan territorial waters. At least one US warship is said to have recently entered the exclusive economic zone and detained a fishing vessel.
#rstats #dataviz

December 2, 2025 at 2:02 PM
Check out the hashtag #30DayMapChallenge
#30DayMapChallenge Day 27: Boundaries 🍮
The Hutt River flood extent in Jello and wafer paper. The coastline is often represented as a hard line on maps, and I played with the idea of rethinking permeable boundaries.
The Hutt River flood extent in Jello and wafer paper. The coastline is often represented as a hard line on maps, and I played with the idea of rethinking permeable boundaries.
December 2, 2025 at 8:38 AM
#30DayMapChallenge Day 27: Boundaries 🍮
The Hutt River flood extent in Jello and wafer paper. The coastline is often represented as a hard line on maps, and I played with the idea of rethinking permeable boundaries.
The Hutt River flood extent in Jello and wafer paper. The coastline is often represented as a hard line on maps, and I played with the idea of rethinking permeable boundaries.

#30DayMapChallenge is technically over... but I'm still 8 days behind so I keep going.
A world map made with land, rivers, lakes and ocean bathymetry datasets from Natural Earth. Color scheme from the True Autumn seasonal color palette
A world map made with land, rivers, lakes and ocean bathymetry datasets from Natural Earth. Color scheme from the True Autumn seasonal color palette

December 1, 2025 at 7:32 PM
#30DayMapChallenge is technically over... but I'm still 8 days behind so I keep going.
A world map made with land, rivers, lakes and ocean bathymetry datasets from Natural Earth. Color scheme from the True Autumn seasonal color palette
A world map made with land, rivers, lakes and ocean bathymetry datasets from Natural Earth. Color scheme from the True Autumn seasonal color palette

Although I didn’t join the 30DayMapChallenge, but it still got me in the mood to plot some city grids using the osmnx library.
#osmnx #matplotlib #pyfonts #dataviz
#osmnx #matplotlib #pyfonts #dataviz

December 1, 2025 at 5:31 PM
Although I didn’t join the 30DayMapChallenge, but it still got me in the mood to plot some city grids using the osmnx library.
#osmnx #matplotlib #pyfonts #dataviz
#osmnx #matplotlib #pyfonts #dataviz